By: Ben Snaidero | Comments (7) | Related: More > Integration Services Control Flow Transformations
Problem
Have you ever had to write a bunch of TSQL to do some data analysis on the table data in your database. If you have you'll know that this can become a fairly time consuming and tedious task? SQL Server 2012 Integration Services has a feature called the Data Profiling task that can help you perform this analysis much easier and faster (this feature is also available in SQL Server 2008). This task can help you find potential issues with your existing data as well as help you become more familiar with the data in a database that you have just started managing.
Solution
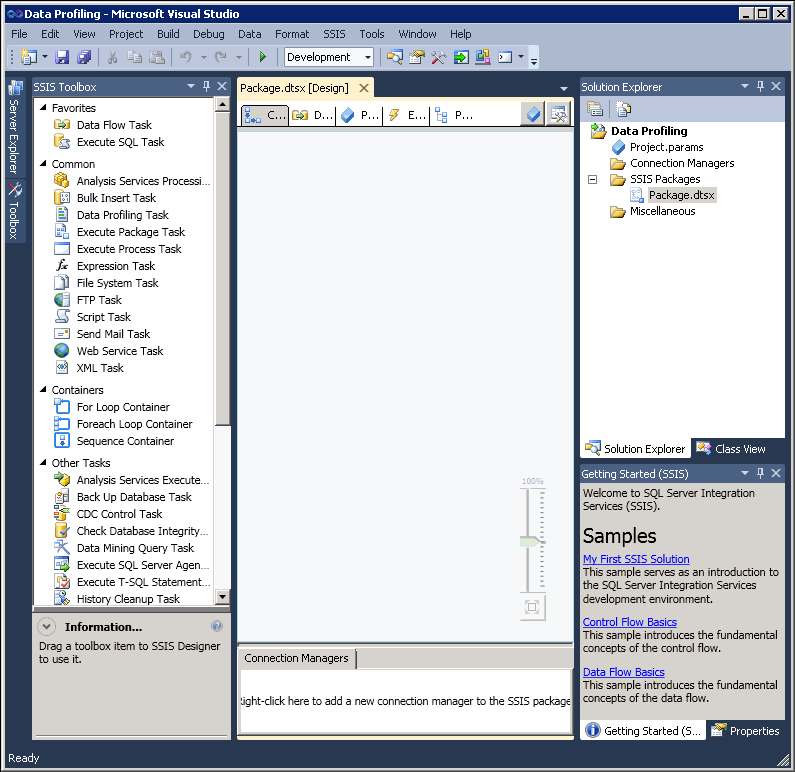
To use the Data Profiling SSIS task in SQL Server 2012 we first need to create a new Integration Services project in SQL Server Data Tools (formerly Business Intelligence Development Studio). Once you've created the project and opened it, your screen should look as follows with an empty package design tab.
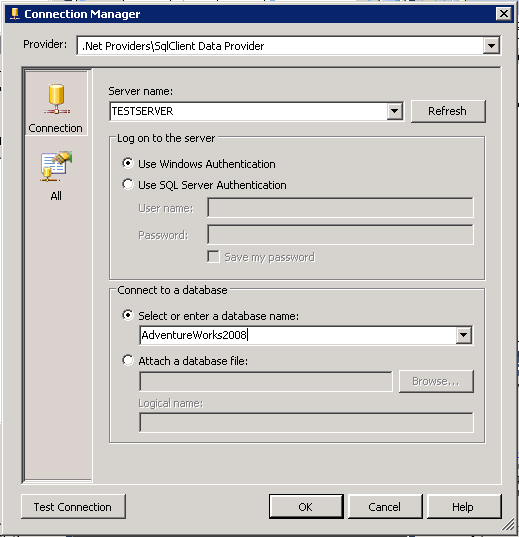
Now that we have a package open we need to add a connection manager object for the database we want to run the profile against. To do this we right click "Connection Managers" in the Solution Explorer and select "New Connection Manager". Then select "ADO.NET" and click "Add...", then click "New..." and then fill in dialog box as show below. Once everything is filled in I like to click "Test Connection" just to make sure it's configured correctly. After this is successful you can click "OK" to complete the setup.
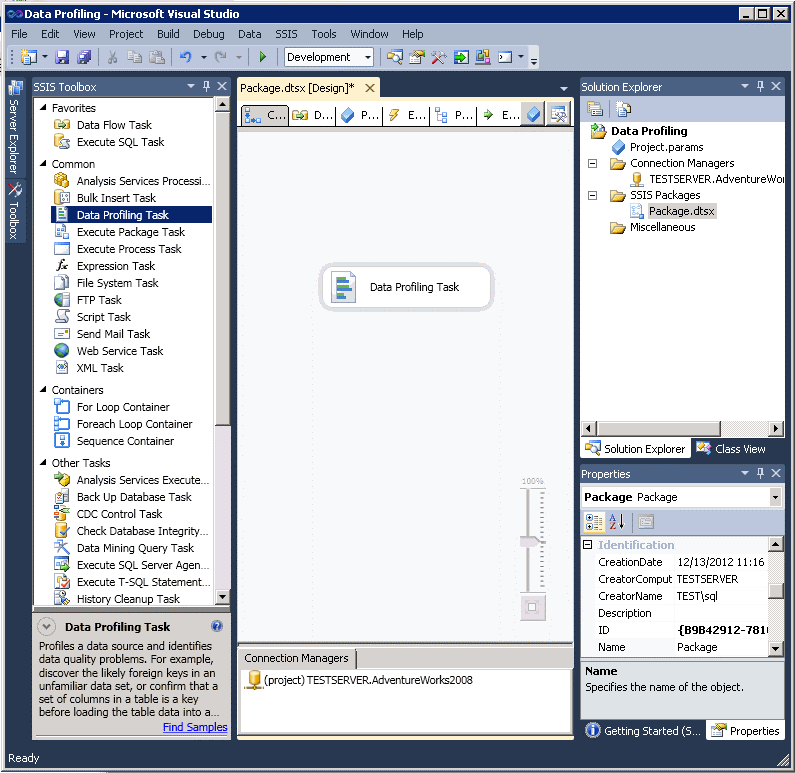
Next we can add the Data Profiling task to the package by clicking and dragging it from the SSIS Toolbox onto the Control Flow panel.
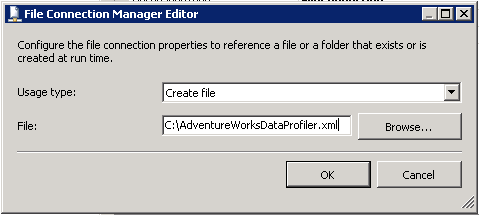
We can start to configure the task by double clicking on the task in the Control Flow panel. A dialog box opens to the General Tab where we can setup our Profiler Output File connection. Click on the Destination property and select "<New File connection...>" and complete the dialog box as shown below. Once complete we can click "OK".
The complete General tab should now look like this.
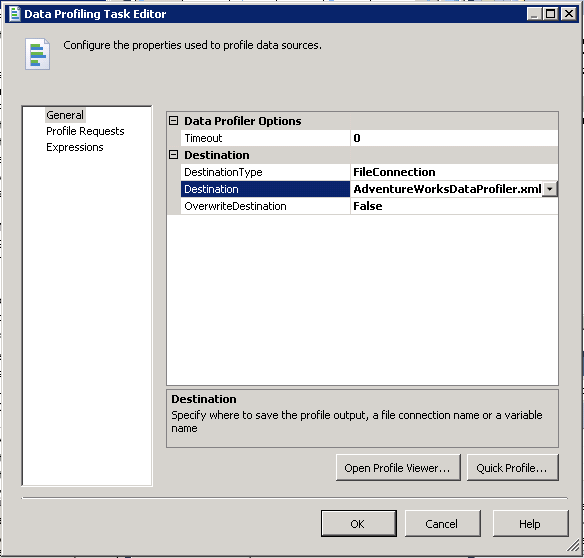
From this panel we have two different methods we can use to configure what we are going to profile. First we can click on "Quick Profile" and we are presented with a form we can use to configure one or more tables to be profiled. For this example I am just going to select a single table and check all the profiles to be computed. A description of each profile can be found here. Once completed the form should look like the one below.
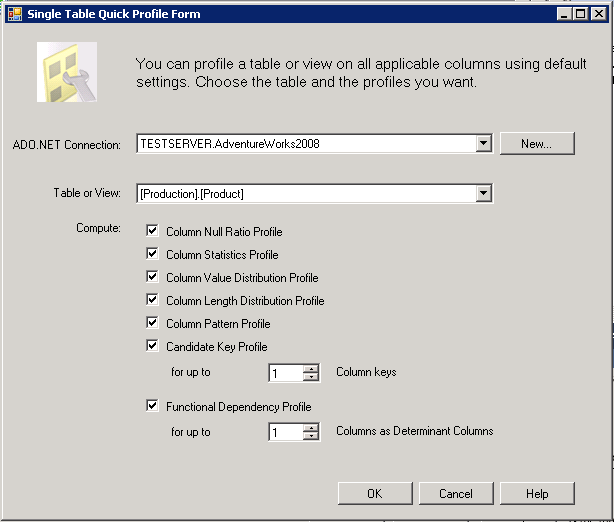
After clicking "OK" on the form above we are taken to the Profile Requests panel which is the other method of configuring this task and could have been selected when the initial form was opened. Looking at the screenshot below we can see all of the Profile Types we selected in the last form are configured here. Looking under the Data subsection of the Request Properties section we can see that we also have the ability to profile one or more columns within the table. As an example, if we were looking for a candidate key we may exclude some columns from the profile that we know for sure would not be part of the key.
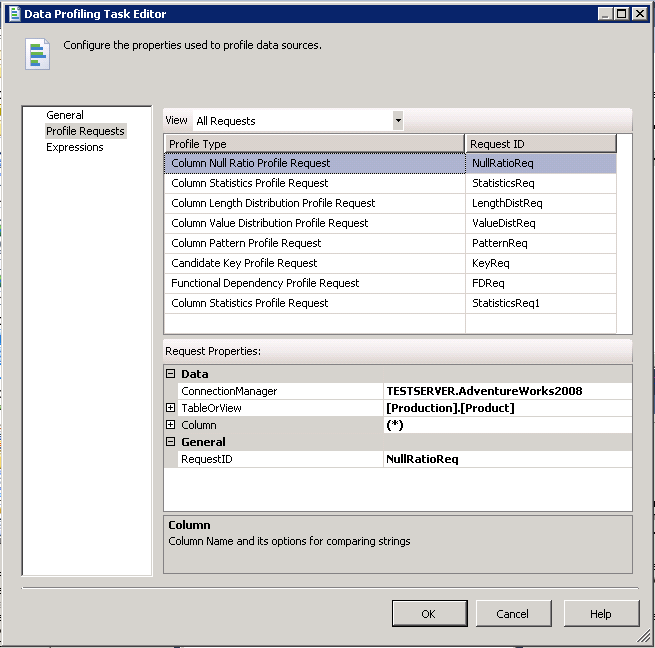
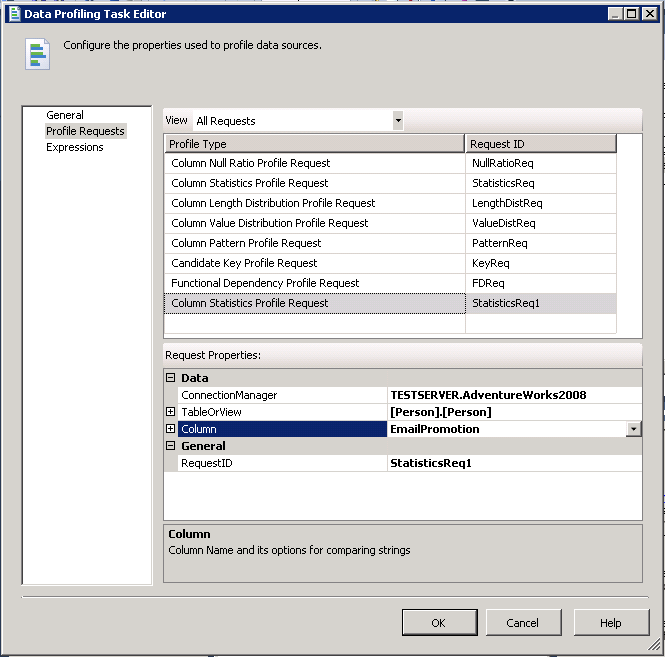
Let's add one more table/column by clicking on the next empty space in the "Profile Type" column. After selecting the profile type we can fill in the "Request Properties" section as shown below by select a connection manager, table/view and columns. In this case we are just going to select a single column. After clicking "OK" to complete the configuration we are taken back to the Control Flow tab of our package.
The configuration of our data profiling task is now complete and we can run it by selecting "Start Debugging" from the Debug menu or by using the F5 shortcut. Once it has completed successfully we have to select "Stop Debugging" from the Debug menu or use the Shift+F5 shortcut to be able to view the output.
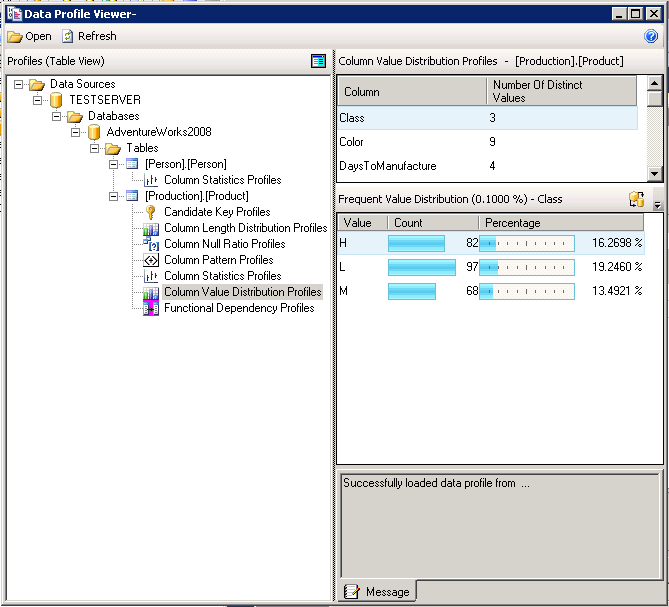
The output file is just a regular xml file, here is a sample, and Microsoft provides two options for launching the Data Profile Viewer which displays this xml file in a nice formatted output. The first way is to double click on the Data Profiling task on the Control Flow tab and it will open up the General tab as it did when you were configuring the task. Once here we can click "Open Profile Viewer". Alternatively we can start the Data Profile Viewer as a stand-alone application. It can be found under the Start Menu -> Microsoft SQL Server 2012 -> Integration Services -> Data Profile Viewer. Once there simply open the output file that was created by the Data Profiling task. Regardless of the method you choose you will get the following window to display the contents of the xml file.
Next Steps
- Take data quality a step further with SQL Server 2012 Data Quality Services
- Use Master Data Services to provide a centralized location for clean, up-to-date data
- More information on SQL Server Data Tools
About the author
 Ben Snaidero has been a SQL Server and Oracle DBA for over 10 years and focuses on performance tuning.
This author pledges the content of this article is based on professional experience and not AI generated.
View all my tips


