By: Daniel Calbimonte | Comments (1) | Related: > Analysis Services Performance
Problem
Sometimes SQL Server Analysis Services query response time is too slow and we want to improve the performance. How can we do so? What options are available to improve SQL Server Analysis Services performance? In this tip we will improve the performance by testing two parameters in the msmdsrv.ini file. Check out this tip to learn more.
Solution
For this tip, I used a demo cube which is 30 GB in size. Each partition contains 17 million rows and they are 30 partitions. In order to gather a baseline time needed for the query, I am going to run an MDX query with SQL Server Management Studio (SSMS):
SELECT  NON EMPTY {  [Measures].[wallet],
 [Measures].[quantity],
  [Measures].[duration] }
 ON COLUMNS, NON EMPTY { ([Date Dim].[ Calendar].[Date].ALLMEMBERS ) }
  DIMENSION PROPERTIES MEMBER_CAPTION,
MEMBER_UNIQUE_NAME  ON ROWS FROM [myCube]
SQL Server Management shows the time in seconds that it takes to complete the query at the bottom of the window as shown below:

SQL Server Profiler
However, in order to test the server time needed, it is better to use SQL Server Profiler to monitor the performance of individual queries. In this tip, we will use SQL Server Profiler to measure the query response time.
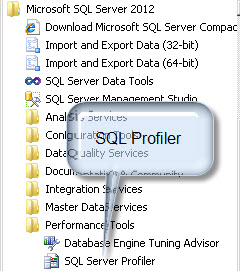
- To get started, open SQL Server Profiler by navigating to Start | All Programs | Performance Tools.

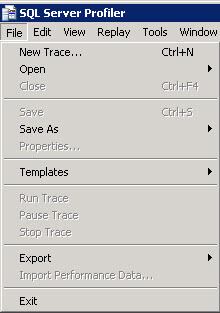
- Once SQL Server Profiler loads, navigate to File | New Trace... or press Ctrl+N.

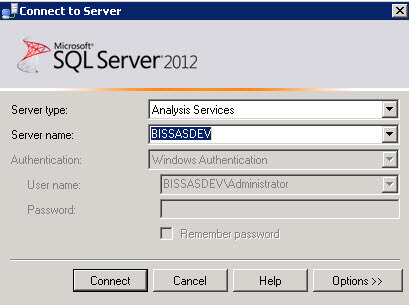
- Connect to the Analysis Services Server where you are testing.

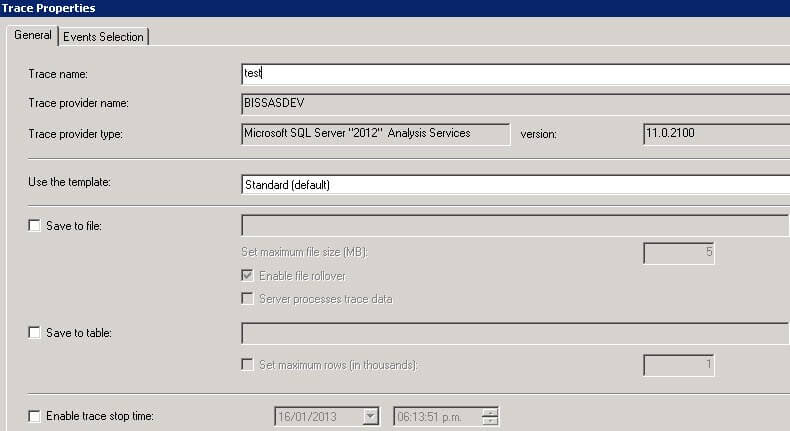
- On the General tab of the Trace Properties screen, select where you are going to store the information for your queries i.e. save to a table or file, a "Trace Name" and template.

- Next, on the Event Selection tab of the Trace Properties select the "Query Begin" and "Query End" events. The "Query Begins" event will show the query start time, who executed the query and which application was used. The "Query End" event records when the query ends. It will also display the duration of the query. Once completed, click the General tab again and press the "Run" button to execute the trace.

- Now execute the MDX query displayed at the beginning of this tip. At the end of the query you will see the duration time in SQL Server profiler.

- The time is in milliseconds. It means that the query took around 45 seconds to run a sum of 17 million rows*30 days= 510 million rows. This query already has Aggregations using the Usage Based Optimization and the Design Aggregation wizards. So, now we have another option which we can use when there are multiple partitions. This option is the msmdsrv.ini file. The msmdsrv.ini file is installed in the root\Program Files\Microsoft SQL Server\MSAS.MSSQLSERVER\OLAP\Config directory.

What we are going to test is the MDX query changing two properties in the file.
Before starting please backup the msmdsrv.ini file and test in a test environment, not production. As I usually say "for this tip, adult supervision is required".
Configure the CoordinatorExecutionMode parameter in the msmdsrv.ini
In order to start, we are going to change the value for the CoordinatorExecutionMode property in the msmdsrv.ini file. The CoordinatorExecutionMode indicates the number of parallel operations that the server will attempt. By default the value is 0, which means that the server will decide the value. Most of the time, this is the most convenient value, but sometimes it is not. In my scenario, I have a test server with 32 cores, so I want to test multiple values to see which one is best. In this case we are going to test the query at the beginning of this tip with the CoordinatorExecutionMode parameter of -8, -6, -4 and -2. In between each test we are going to clear the cache.
If you run the query you will notice that the execution time is 1 second once the query is stored in the cache. Whenever you run the same query again it will be faster than the original execution. This is great for the customer, but in my case we need to test the query improvements so we are going to create a XMLA script in SSMS by clicking on the XMLA icon as shown below:

Now, we are going to clear the cache with this XMLA script. Be sure to change the DatabaseID according to your database.

Now we can run the query four times with the values of CoordinatorExecutionMode= -8, -6, -4 and -2 and clear the cache between each execution. The table below records the time required to run each query according to SQL Server Profiler. As you can see, the best query response time for my test environment is with a CoordinatorExecutionMode value of -6 and the average time was 26 seconds.
| CoordinatorExecutionMode Value | Query response time (seconds) |
|---|---|
| -8 | 35 |
| -6 | 26 |
| -4 | 32 |
| -2 | 37 |
Configure the CoordinatorQueryMaxThreads parameter in the msmdsrv.ini
Now we are going to use a similar strategy with the CoordinatorQueryMaxThreads property in the msmdsrv.ini file. This property determines the number of threads per partition. Now let's try to test the response time with different values and clearing the cache between each execution. We found the following results:
| CoordinatorQueryMaxThreads Value | Query response time (seconds) |
|---|---|
| 16 | 26 |
| 18 | 23 |
| 20 | 20 |
| 22 | 13 |
| 23 | 18 |
| 30 | 18 |
| 32 | 19 |
As you can see from the table above, the best query response time according to SQL Server Profiler had a CoordinatorQueryMaxThreads value of 22 and the response time was 13 seconds.
Conclusion
In my scenario with my hardware and cube, the best query response time with the CoordinatorQueryMaxThreads = 22 and the CoordinatorExecutionMode = -6 parameters in the msmdsrv.ini file. Keep in my the best parameters depend on the database and the hardware. Also note that these parameters help mainly when you have multiple partitions, which in my case I had 30 partitions. You may need to test with different values in your own server and I am sure the results will be different. The main idea is to test the configuration results with different values and verify which options best suits your environment. Good luck!
Next Steps
- You can find more information about msmdsrv.ini values here:
About the author
 Daniel Calbimonte is a Microsoft SQL Server MVP, Microsoft Certified Trainer and 6-time Microsoft Certified IT Professional. Daniel started his career in 2001 and has worked with SQL Server 6.0 to 2022. Daniel is a DBA as well as specializes in Business Intelligence (SSIS, SSAS, SSRS) technologies.
This author pledges the content of this article is based on professional experience and not AI generated.
View all my tips


