By: Scott Murray | Comments (2) | Related: > Analysis Services Development
Problem
How does the standard deviation and related statistical functions work in SQL Server Analysis Services? Are those functions natively available? Can you call this code in MDX? Check out this tip to learn more.
Solution
The standard deviation function is SQL Server Analysis Services (SSAS) 2012 calculates values similar to other statistical tools yet several caveats exist when looking at the results and which figures result in errors. First, care must be taken to understand how filters and custom MDX affect the results. Second, the dimension level used impacts the standard deviation calculation. Furthermore, four standard deviation MDX functions exists in the statistical function set: STDEV, STDEVP, STDDEV and STDDEVP. Actually two of the functions, STDDEV and STDEVP are aliases for STDEV and STDEVP, respectively. Not surprisingly, the difference between STDEV and STDEVP goes back to some basic statistics. STDEV uses what is called an unbiased population (dividing by n-1....see Sample standard deviation and bias | Probability and Statistics) whereas STDEVP uses a biased population (dividing by n....see Review and intuition why we divide by n-1 for the unbiased sample).
STDEV and STDEVP in SQL Server Analysis Services 2012
Deciding whether to use STDEV or STDEVP requires a good understanding of the difference in the calculation method, the data to be evaluated, and is often an academic exercise. However, the results of each can produce dramatically different values. We need to remember that standard deviation is a measure of dispersion from the mean; the key is whether the group of numbers we are evaluating is a finite group of numbers where using n or STDEVP is correct or is the list of values just a sample of the entire population. Okay enough statistical theory; let us move to some real world examples. As usual, we will use the AdventureWorks 2012 DW SSAS database which can be downloaded from CodePlex. Let us look at the basic syntax of both standard deviation functions.
STDEVP(Set_Expression [ ,Numeric_Expression ] )

or

STDEV(Set_Expression [ ,Numeric_Expression ] )
Thus, the function requires two arguments; first you must provide a set of values
over which the measure will be evaluated, and then you must provide the numeric
measure to be evaluated. For instance, we could say that the set expression will
be all the individual date values in a date hierarchy. Secondly, we could provide
a sales value as the numeric expression. Following through with this example, the
below illustration uses the Date.Calendar dimension and specifically the Current
Members.Children function as the set expression and the Internet Sales Amount as
the numeric measure value. For the below example, we are using the biased value
since we should have all values in a population. Also note that using CurrentMember.Children
for the set will always look down one level from the point in the calendar hierarchy
selected, and thus will return all values one level below the selected Date.Calendar
hierarchy level.
STDEVP
   ( { [Date].[Calendar].CurrentMember.Children},
                [Measures].[Internet Sales Amount])
The results of this calculated measure are displayed in the Excel Pivot Table below; note that this calculation is STDEVP or a biased n value (dividing by n).
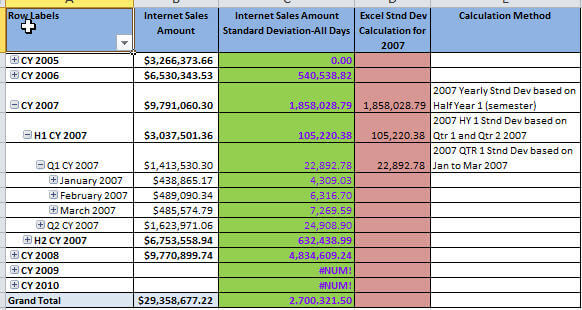
At a first glance the calculations seem to be working well. The figures in the green column display the SSAS calculated measure. Notice a few of the fields have #NUM! and a few have 0; the reason for the errors and zero value cells will be discussed later in this tip. The purple column displays the values Excel calculated for the standard deviation of a population while the last column displays how Excel (and SSAS) performed the calculation to arrive at the figure displayed.
Next, we can switch to using the unbiased standard deviation calculation, STDEV.
STDEV
   ( { [Date].[Calendar].CurrentMember.Children},
                [Measures].[Internet Sales Amount])
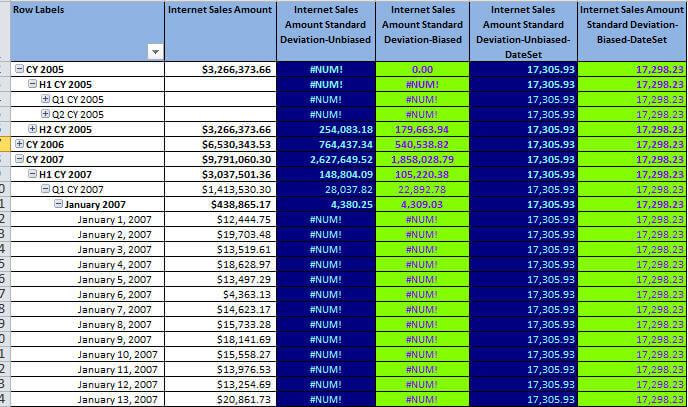
The results of this calculated measure are displayed in the Excel Pivot Table below; note that this calculation is STDEV, so an unbiased sample (dividing by n-1) is used.
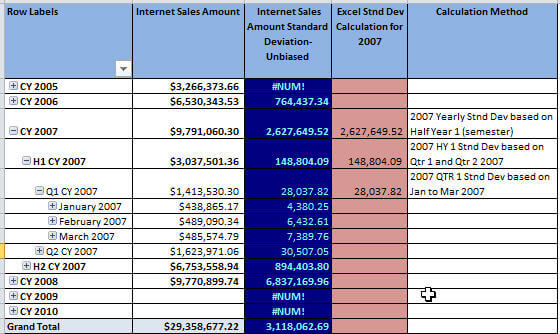
Again the figures in the above screen shot from Excel display, for the most part, valid figures. The figures in the blue column display the SSAS calculated measure for a sample population; the remaining columns are the same as the previous example. You may be saying, so what is wrong with the calculations as Excel has validated several of the pivot data points. There are actually several points of contention that I will outline next. First, notice how the CY 2005 line item displays 0 (zero) for the biased calculation, but displays #NUM! (an error) for the unbiased calculation. Let us drill down into the 2005 figures to see what is happening.
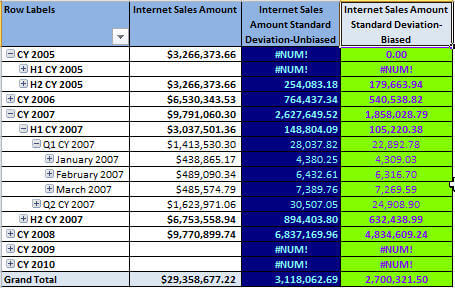
Actually, the results make sense when we work through the details of what the calculation is looking at for its inputs. For the biased calculation, the zero value is derived as follows:
- Two possible values potentially exist for the base Internet Sales Amount figure, one for Half Year 1 (H1 CY 2005) and one for Half Year 2 (H2 CY 2005). Remember, CurrentMember.Children looks at only the values one level below the currently selected member.
- However, Half Year 1 (H1 CY 2005) actually is "Nothing" or NULL in SQL speak, so that value is actually excluded from the calculation.
- Thus, we have one value for our calculation, so the median is that same as the original value, and our "n" value is 1. This results in a calculation of 0/1 or 0.
To the contrary, the unbiased calculation uses the following calculation process:
- Two possible values potentially exist for the base Internet Sales Amount figure, one for Half Year 1 (H1 CY 2005) and one for Half Year 2 (H2 CY 2005).
- However, Half Year 1 (H1 CY 2005) actually is "Nothing" or NULL in SQL speak, so that value is actually excluded from the calculation.
- Thus, we have one value for our calculation, so the median is the same value as the original value, and our "n" value is 1, but the unbiased calculation uses "n-1". This results in a calculation of 0/0 or #NUM! ERROR.
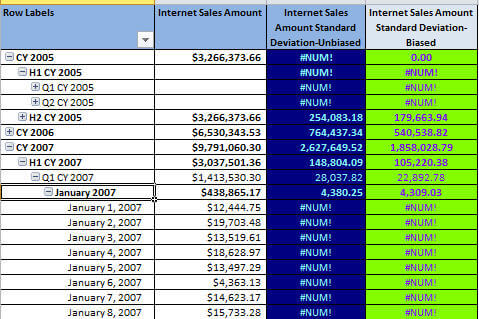
Another issue that surfaces with either standard deviation function centers on
how we define the set to be evaluated. In this particular instance, we are using
the Date.Calendar hierarchy and the CurrentMember.Children function to allow us
to navigate the hierarchy. Unfortunately, what happens in our example, when we navigate
to the "bottom" of the hierarchy, the date level, we again get an error as illustrated
below. The reason for the error stems from the fact that there are no "children"
data points below the Date level in the set, so the error results.
One way around this issue is to explicitly assign the level of the set to be used within the hierarchy. Thus, we can switch the set expression to use the Date.Calendar.Date members for the set, as displayed below, which means that no matter what level is displayed, the standard deviation will always be the standard deviation calculated for all values at the individual date level!
STDEVP
   ( { [Date].[Calendar].[Date].Members},
    [Measures].[Internet Sales Amount])

OR

STDEV
   ( { [Date].[Calendar].[Date].Members},
        [Measures].[Internet Sales Amount])
The results of this new formula are shown below; look specifically at the two right most columns. Now, a value exists for all the individual levels, but it is exactly the same for every date. You can see that defining the set values is extremely important and should be reflective of the exact data point and level needed.
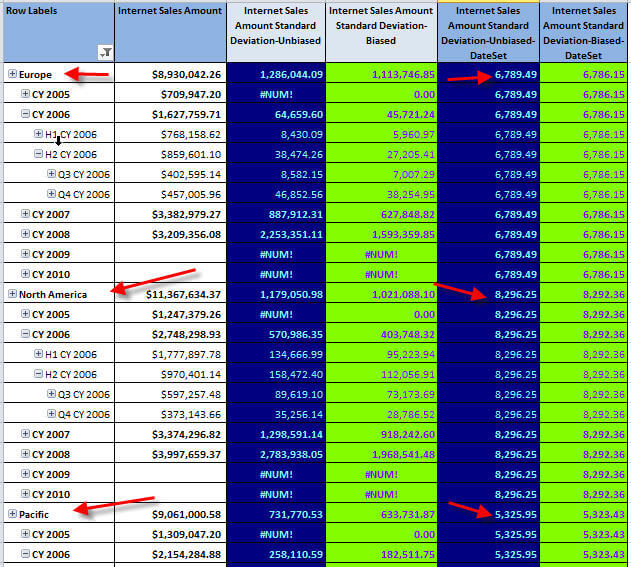
Of course, not all the news is "bad" about standard deviation; as you see in the below screen sho, you can drill down into various dimensions and the standard deviation does adjust for the slicer you put into place on the pivot. The pivot below drills into the Sales Territory dimension, and appropriately adjusts the value for the standard deviation based on the dimension selection.
In many instances, you may be concerned with providing a standard deviation calculated
member in the cube without end users having a thorough understanding of how the
calculation is made. Of course, as a result of the variations and sensitivity of
the standard deviation calculation, it may be beneficial to hand write the MDX query
instead of using a cube calculated measure. The syntax is somewhat similar to the
cube calculated measure method, but as detailed in the below code snippet, we are
using a calculated member (aka named set) for the MDX query, and then returning
that value in the actual Select clause. You will also notice that for the Set expression
on the standard deviation function (line 5 in the below example), we are restricting/filtering
the set to only include calendar date values between 2007-01-01 and 2007-12-31.
This method of hand coding the MDX provides us with a method of controlling the
set used to calculate the standard deviation.
WITH
  MEMBER [Internet Sales Amount Standard Deviation-Biased-DateSet] AS
    (
 STDEVP
   ( { [Date].[Calendar].[Date].&[20070101] : [Date].[Calendar].[Date].&[20071231]}, [Measures].[Internet Sales Amount])
 ),
FORMAT_STRING = '#,##0.00;-#,##0.00'
SELECT
{
[Measures].[Internet Sales Amount],
[Internet Sales Amount Standard Deviation-Biased-DateSet]
} ON COLUMNS,
[Date].[Calendar].[Date] ON ROWS
FROM [Adventure Works];
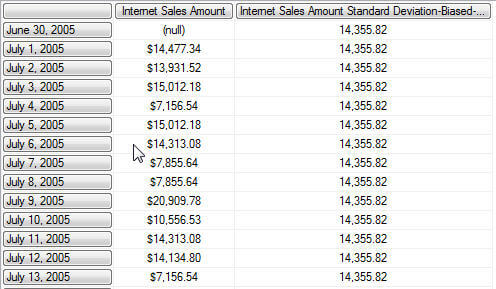
The below screen shot displays the standard deviation result based on an MDX query which is filtered to just use the 2007 data set.
Conclusion
The standard deviation functions in SSAS, STDEV and STDEVP, provide a way to calculate the standard deviation for a specific measure within a set of data. Within the function, the exact set which is defined and is to be traversed for the calculation is ultimately very important. The set specified controls which values will be evaluated by the standard deviation function and whether or not an error is displayed. Some options which can be used to define a set include "hard coding" a set of values, using a filtered list, or utilizing a dynamic list based on a selected value, such as CurrentMember.Children. Alternately, to garner more control, running the function within a MDX query sometimes provides more control for the user to complete the standard deviation calculation. The standard deviation functions work well; however, as with many MDX and SSAS functions, a good understanding of the calculation is key to getting valid results.
Next Steps
- Check out these additional resources:


About the author
 Scott Murray has a passion for crafting BI Solutions with SharePoint, SSAS, OLAP and SSRS.
This author pledges the content of this article is based on professional experience and not AI generated.
View all my tips
