Problem
In my last tip I talked about diagnostic logging in SharePoint 2010 and how it helps in troubleshooting. Troubleshooting with trace files is good but wouldn’t it be cool if we have all the logging (usage and health) information on single place in consolidated form which help you to build reports and do analysis on collected data from all the servers of the farm? I heard SharePoint 2010 has new logging database. What is it, what does it store? How we can control the amount of information to be logged in the SharePoint logging database?
Solution
SharePoint 2010 is now capable of accumulating all the usage and health related data (log files) from all servers in the farm into a new SQL Server database. This centralized consolidation of data, from all servers helps you to better generate reports for analysis purposes and troubleshooting. You can even use it as external content types or a list to Business Connectivity Services(BCS). By default this is enabled and data gets aggregated using a timer job.
As opposed to other SharePoint databases, this database is fully supported for reading and writing whenever you need to do so, as the schema is public.
Now if you are wondering why is only this database supported for reading and writing then the reason is very simple. The logging database aggregates usage and health data from trace files from all servers (already gathered information on the servers).
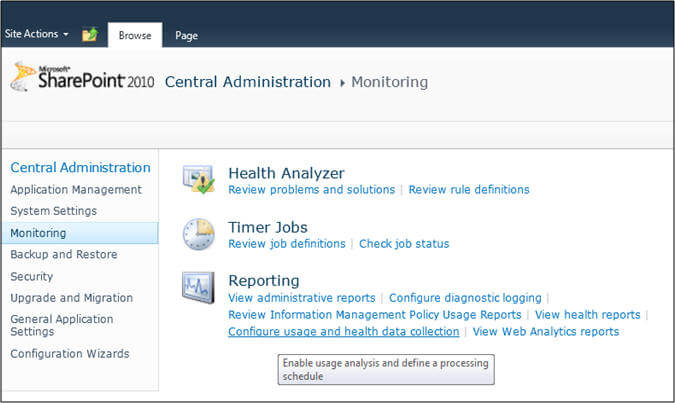
Before digging more into this database, lets see how to configure and control what and when to be aggregated in the logging database. Go to the Monitoring link on the left side of SharePoint 2010 Central Administration and click on the “Configure usage and health data collection” link under Reporting as shown below:
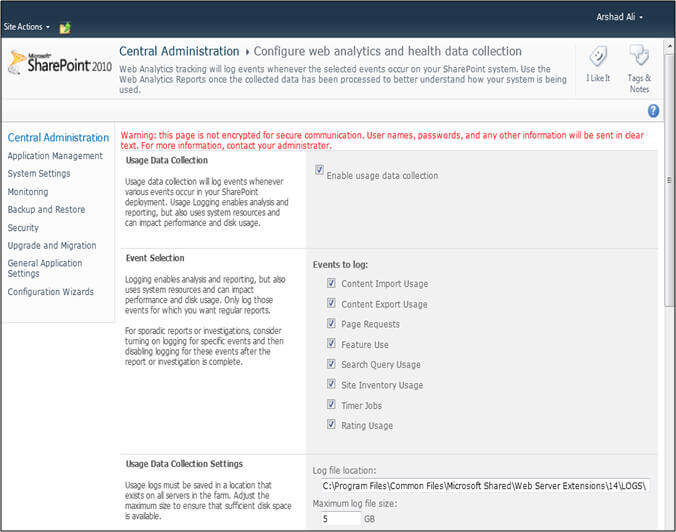
As I said before, by default, usage data aggregation is enabled as you can see in the image below. You can choose which events you want to be captured. By default all 8 events are chosen, you should consider choosing only those which are required as more event logging will have impact on the performance.
Next you need to specify the log file location and maximum size of the log file to be maintained at a time. By default it is stored in a log folder of the “14 Hive” or the SharePoint root folder along with trace files. You should consider changing this location to some other drive than the drive on which SharePoint has been installed. (A high speed drive might be good, especially in case you are using verbose logging).
Also make sure that same location is available on all the servers of the farm.
When you scroll down the page below, you will notice that even health data aggregation is also enabled by default. You can change the default Log Collection Schedule or Health Logging Schedule by clicking on either of these links. Each element can be individually scheduled.
Next you need to specify the server name, database name and authentication details to connect to the database for logging. It is recommended to have the SharePoint logging database on a separate server or separate drive with its own spindles. By default database name is WSS_Logging.

When you click on the Health Logging Schedule link as shown in the image above, you will be taken to another page (shown below). Notice there are several timer jobs with different schedules to collect the different health related data. Again the more logging you do or the more frequently you do it, there will be an impact on the performance and you should change it as per your need. You will notice that it does not only capture data related to SharePoint but also capture SQL Server related events as well.

Now connect to the server and database to which you specified above.
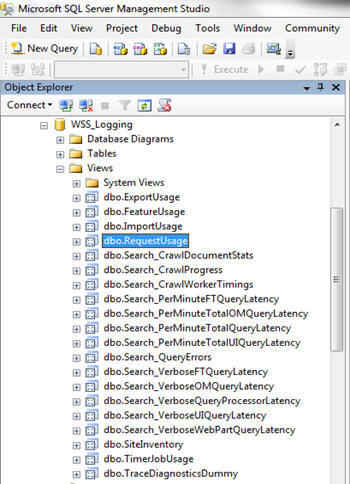
By default the database name is WSS_Logging which has several partitioned tables as shown below:

Don’t worry about writing complex queries from these partition tables. There are several views built on top of these partition tables to simplify your queries.
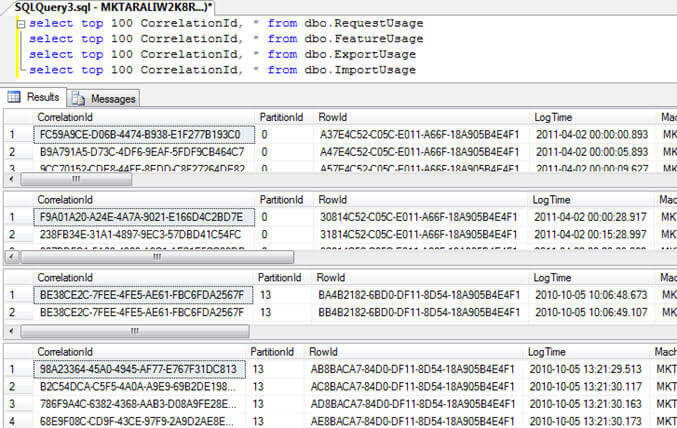
You can query these views as shown below. Please note these views have a column called CorrelationId about which I talked in my last tip. The Correlation Id is a GUID which gets assigned to each log entry. When there is any error on the page SharePoint 2010 shows this correlation Id on the page. You can take this correlation Id and do a search to find the reason for failure. Now the best part is the Correlation Id is grouped on the same conversation/session (initiated by a user) on the server and across the servers so that you can relate all the related log entries together. Also the correlation Id is not generated in case of an error only, but for all the conversations, which helps you to troubleshoot a slow loading of page as well.
Notes
- The SharePoint logging database is fully supported for reading, querying or even writing data back to it unlike other databases of SharePoint.
- The capturing of usage and health data collection is enabled by default.
- It is recommended to have the SharePoint logging database database on a separate server or separate drive with its own spindles. By default database name is WSS_Logging.
- By default, information is logged in a Log folder under the root folder where SharePoint has been installed. You should consider changing this location to some other drive than the drive on which SharePoint has been installed (and consider a high speed drive especially in case you are using verbose logging). Also make sure that the same location is available on all the servers of the farm.
- A developer can write custom messages for diagnostic logging using the SPDiagnosticsService class. Not only that, you can even control the diagnostic logging behavior programmatically using this class. Please note it does not work in a Sandboxed environment (unless you create a full trusted proxy and call it from the Sandboxed solution). There is an unsupported ULS log viewer which you can use to view the log in a more user friendly interface instead of using standard log file viewers.
Next Steps
- Check out the tip on Diagnostic logging in SharePoint 2010

Arshad specializes in Database, Data Warehousing and Business Intelligence application design, development and deployment, at enterprise level, with SQL Server, SSIS, SSRS, SSAS, Service Broker, MDS, DQS, SharePoint and PPS. He is a Microsoft Certified IT Professional in Microsoft SQL Server. He also has experience developing applications in VB/ASP/.NET/ASP.NET/C#, and is a Microsoft Certified Application Developer and Solution Developer for the .NET platform in Web/Windows/Enterprise. Arshad has Master’s degrees in Computer Applications and Business Administration in IT.
Disclaimer: Arshad worked for Microsoft and helped people and businesses make better use of technology to realize their full potential. The opinions mentioned in his tips and articles herein are solely his and do not reflect those of his current or previous employers.
- MSSQLTips Awards: Champion (100+ tips) – 2014