Problem
A new release of SQL Server Analysis Services (SSAS) means also new functions and functionality in the DAX language. In this tip, we’ll give an overview of the new improvements and enhancements for Analysis Services 2017.
Solution
With the release of SSAS 2017 a couple of new functions were introduced as well as a bit of new functionality. Keep in mind that everything described in this tip will be available in SSAS 2017 in the latest compatibility level (1400), but not necessarily in earlier compatibility levels. Unfortunately, the official documentation doesn’t mention in which compatibility levels a function is available. Similarly, new functionality will most likely be present in the latest versions of Power BI Desktop, but not in earlier versions and the same can be said about Excel.
In this tip we’ll use the WideWorldImporters Tabular model, which was created in the tip Using Calculated Tables in Analysis Services Tabular 2016 for Aggregate Tables – Part 3.
ERROR function
The new ERROR function allows you to raise your own error messages. Let’s suppose we want to calculate a sales amount measure in the WideWorldImporters model:
However, it’s possible someone enters a unit price which is incorrect. Assume the company doesn’t sell items with a unit price over $1,000. We can embed some validation inside the formula which checks if the unit price doesn’t exceed the $1,000. If it does, an error is thrown so users are notified something is wrong with the source data.

If we would use the measure in Excel, we get the following result:

In Power BI the whole visualization errors out. You have to click on See Details to get the error message:

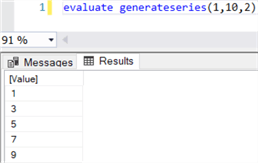
GENERATESERIES function
This function will most likely be useful as an intermediate step for other, more complex formulas. GENERATESERIES generates a sequence of values with a start and end value. Optionally you can specify the increment. The output of the function is a table holding the sequence.

With an increment value of 2 specified:
You can also use other data types, such as decimal number or currencies. Dates are supported as well:
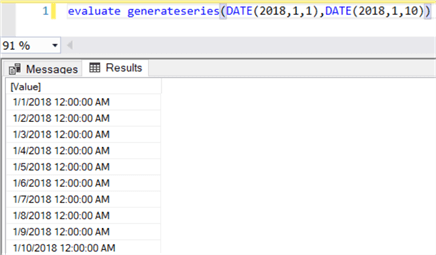
In this case, the result is similar to the CALENDAR function.
IN Operator
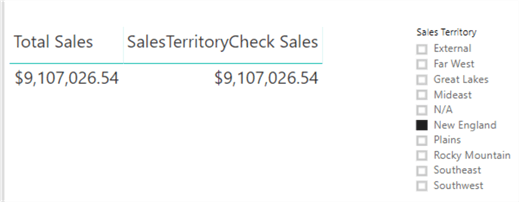
A nice addition to DAX is the IN operator, which in its simplest form is equivalent to the T-SQL counterpart. Let’s calculate the sales for two sales territories:
This gives us:

The CONTAINSROW function is equivalent to the IN operator:
We can verify this in the PivotTable:

Unlike T-SQL, there isn’t a NOT IN operator. In DAX, to have the logical negation of the IN operator, you need to put the NOT function in front of the entire expression:
Which yields the following result:

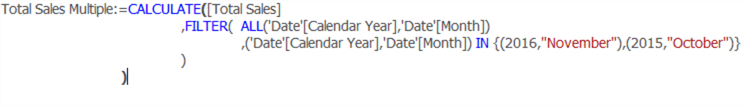
You can also use multiple columns with the IN operator. For example, let’s calculate sales for November 2016 and October 2015.
A thorough and detailed write-up on the IN operator by Marco Russo can be found in the article The IN operator in DAX.
SELECTEDVALUE function
Like GENERATESERIES, the SELECTEDVALUE function will most likely be used in more complex formulas and not on its own. The function returns the value for a column when a single, distinct value has been selected (or filtered). If it isn’t, you can supply an alternative result with an optional parameter. Let’s test this with a simple formula:
In a PivotTable, this gives the following result:

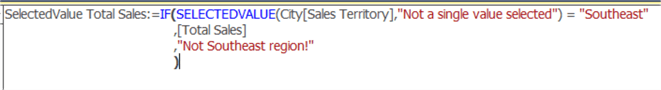
You could also use the formula to validate the input of a slicer. For example, only show a value in a visual if a single value on the slicer is selected:
If one value is selected on a slicer, the result of Total Sales is shown:
If nothing is selected, the slicer defaults to All, and the formula returns N/A:

In Power BI Desktop, even when the slicer is configured for single selection, you can select multiple values when holding CTRL while clicking. With the formula, we can validate the input:

TREATAS function
This function is a bit more special. TREATAS applies the result of an expression as filters to columns of an unrelated table. Let’s illustrate with an example. The Order table contains two dates: the Order date and the Picked date. Since Tabular doesn’t support two relationships to the same table, we need to create another date table for the picked dates. We can easily do this with a calculated table:

This expression simply takes a copy of the existing Date table. Then we need to create a relationship between the new PickedDate table and the Order table:

Now we can use TREATAS to apply the filter on the Order date years to the Picked date years:
If for example someone filters the orders for the year 2015, the formula returns the following result:
“return all sales for orders placed in the year 2015 and the orders are also picked in the year 2015”
Orders at the end of 2015 which were picked in 2016 are excluded. In Excel we get this result:
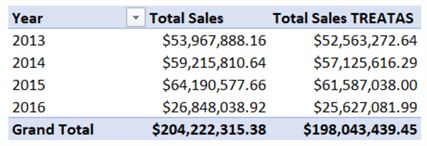
As you can see, the result with TREATAS as a bit lower than the full total sales for a year, since some orders are picked in the year after. The grand total is a bit less as well, since there are blank values for some picked dates (which signifies orders which haven’t been picked yet).
Various Enhancements
Some smaller additions to DAX:
- The UNICHAR function returns the Unicode character referenced by a numeric value. You could use this to create lightweight KPIs. A simple example using the thumbs-up emoji (number 128,077):

- According to the official documentation, the syntax for the table constructor is introduced in Analysis Services 2017. However, it seems it could already be used before, as this article demonstrates. The tip Scenarios for Using Calculated Tables in SSAS Tabular 2016 or Power BI Desktop – Part 2 also gives other options to create small tables with DAX.
- The following functions now support string data types: MIN, MAX, MINX and MAXX.
Next Steps
- You can find an overview of the new DAX functionality in SSAS 2016 in the tip Enhancements for the DAX language in Analysis Services 2016.
- The model used in this tip can be downloaded here.
- You can find more Analysis Services tips in this overview.
- The official documentation about the new DAX features can be found here.

Koen Verbeeck is a seasoned business intelligence consultant with over a decade of experience with the Microsoft Data Platform. He holds several certifications, including Azure Data Engineer. He’s a prolific writer, with over 375 articles on technologies such as Microsoft Fabric, SSIS, ADF, SSAS, SSRS, MDS, Power BI, Snowflake and Azure services. He has spoken at various events such as PASS, SQLBits, dataMinds Connect and many others. He frequently delivers educational webinars on MSSQLTips.com. For his efforts, Koen has been awarded the Microsoft MVP data platform award for many years.
- MSSQLTips Awards:
- Leadership Award (200+ Tips) – 2021
- Author of the Year – 2014/2020/2022
- Author Contender – 2024/2025