By: Rahul Mehta | Comments (1) | Related: > SharePoint
Problem
SharePoint Online stores record information in a repository known as SharePoint Lists which are like SQL Server tables. SharePoint also allows users to store documents in a repository known as a "Library". A Library can store different kinds of documents like Microsoft Office files, PDFs and others. It has the capacity to store millions of documents, but a challenge is how to use the information to create interactive and visual comparisons with SharePoint Online.
Solution
With the evolution of Power BI, Microsoft provides Power BI as a business analytics service. Microsoft also provides integration of Power BI with SharePoint Online. Power BI allows developers to use a SharePoint Library as a data source and generate interactive reports via Power BI online. It can then further be embedded in SharePoint Online. In this tip, we will show the steps to perform this process.
Before we move forward, I suggest going through this previous tip on "Deploying Power BI Reports to SharePoint Online". We are going to use a similar procedure here.
Let's start the process:
- The first step is to create a data source in SharePoint Online Library. For that I suggest creating a SharePoint Library and a folder inside a Library. For those who don't know how to create, please review these links below:
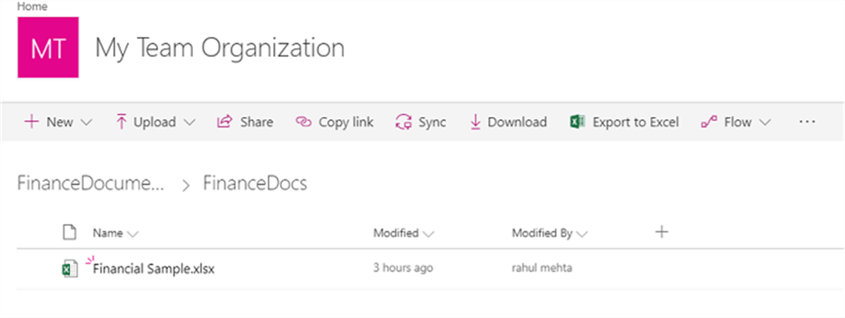
I have uploaded a sample file "Financial Sample.xlsx" in the folder "FinanceDocs". So, the final path of my library is "FinanceDocuments > FinanceDocs > Financial Sample.xlsx".
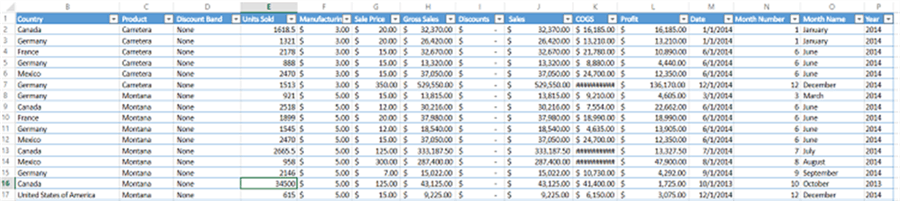
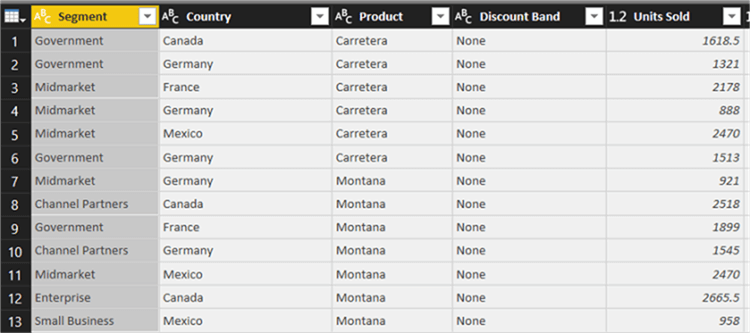
Here is a sample of the data:
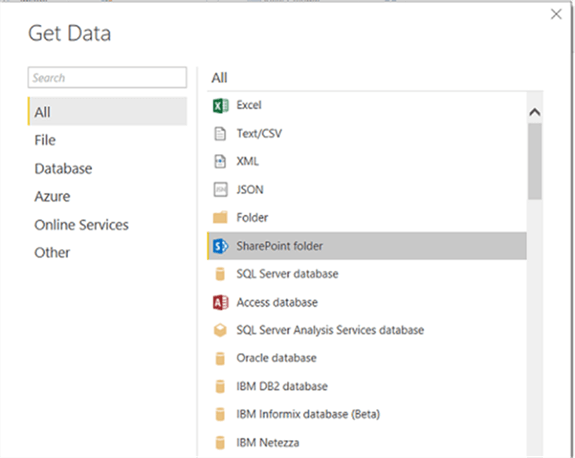
Open Power BI desktop, let's create a data source so we can use it to generate charts. We need to select "SharePoint Folder" as a data source which is available under All as shown below. “SharePoint Folder” will provide all the files available at the specified data source in a flat hierarchy. Let’s select our data source. To do so, click on the "Home Tab > Get Data > More > All" and a similar screen as shown below should appear.
Select "SharePoint folder" and click "Connect".
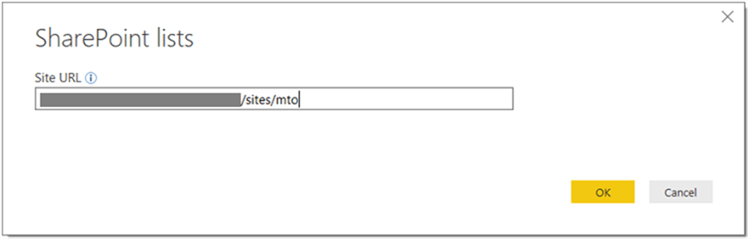
A screen will appear to complete the SharePoint Site information. Enter the site name and click "OK".
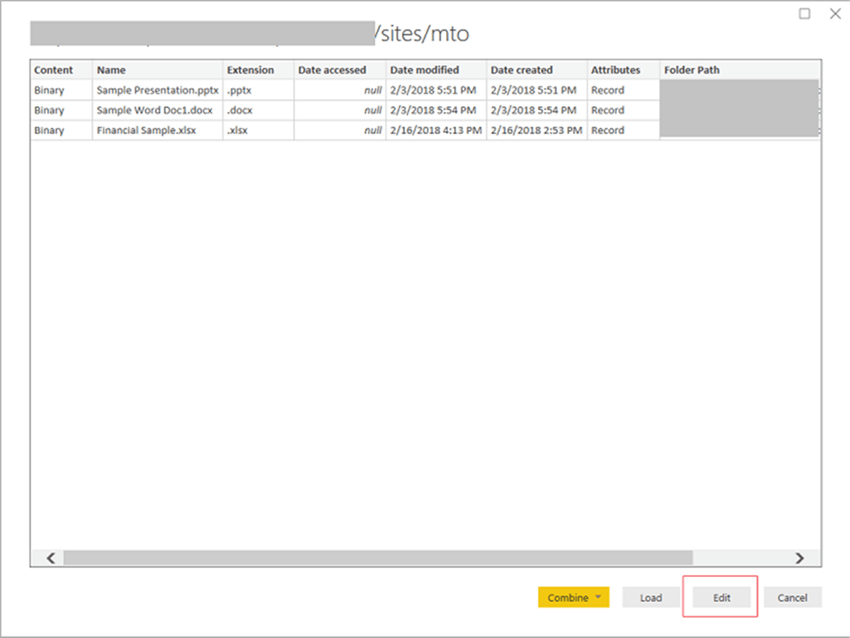
A screen with all the available documents will be shown. Click "Edit" and another window will open.
This is the window that opens after clicking edit.
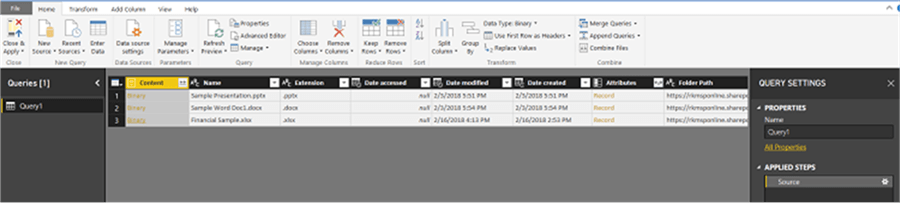
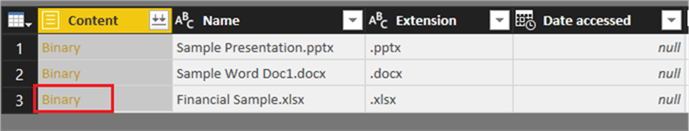
This window shows all the documents with its metadata. For this tip we will concentrate only on one file, thus we will select "Financial Sample.xlsx" which is the last file on the screen. The first column is the type of content. In our case, it is binary. Click on the link “Binary”.
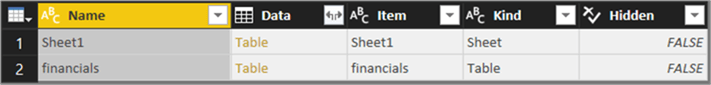
This opens the data that is available, in our case it is a table “financials” as well as a sheet “Sheet 1”. You can see there are other links under the "Data" column which states the type of data i.e. "Table". Click on "Table" for the financials row.
This will open the data as shown below.
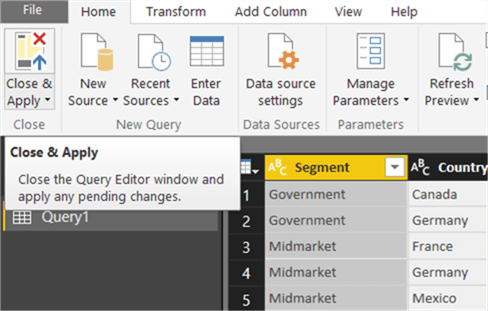
Now let’s create a connection, pull the data and start creating reports. In the above screenshot, you will be able to see "Home Tab > Close & Apply". Click on that option and you will be redirected to the home screen with an established connection.
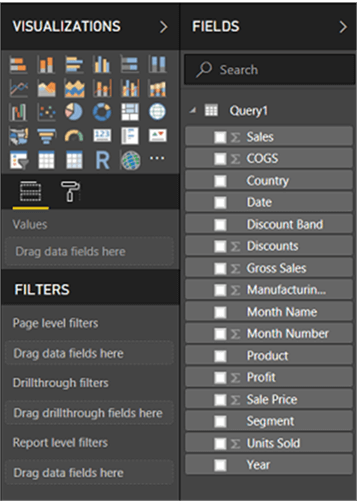
As shown below, we will be able to see visualizations and fields.
Now you can follow steps 7-17 from this article "Deploying Power BI Reports to SharePoint Online" to create a Power BI report in SharePoint Online.
Next Steps
- Integrate multiple data sources from SharePoint Online and generate powerful reports in Power BI.
- Check out these other Power BI tips.


About the author
 Rahul Mehta is a Project Architect/Lead working at Tata Consultancy Services focusing on ECM.
This author pledges the content of this article is based on professional experience and not AI generated.
View all my tips
