Problem
SQL Server Management Studio is a graphical tool to configure, monitor and perform administrative tasks for SQL Server. This graphical tool makes the task much easier, but do you know what queries SQL Server runs when we perform certain tasks using SSMS? SQL Server also sends certain information back to Microsoft; how can we view that information for the queries we are running?
In this tip, we will explore how can we view and capture the queries running by SQL Server while doing tasks in SSMS and telemetry information for the queries we run in SSMS.
Solution
In one of my previous tips, New Features in SQL Server Management Studio v17, we saw that SSMS is now a separately installed component and is not part of the SQL Server set up. SSMS 17.x contains many exciting new features, you can explore some of these features in the SQL Server Management Studio tip category.
Once we connect to an instance in SSMS, go to View > Output or use the shortcut key (Ctrl+Alt+O).

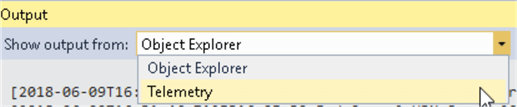
Once you click on Output, it opens up an output window having two drop-down options:
- Object Explorer
- Telemetry
Let’s explore these options.
SQL Server Management Studio Object Explorer Data
One of the new features introduced in SSMS v17.x is that we can now see the queries, which SQL Server is running after clicking on an option in SSMS. Previously we had to run Profiler or an Extended Events session to capture the queries running. If we work with the GUI, normally we do not give much attention to the queries that are running behind the GUI, but this is an interesting feature to see the queries executing in the background.
Object Explorer shows the query text and elapsed time of the SQL queries needed to expand nodes in Object Explorer. This also gives information about the event timestamp and logs the begin and end query event.
Let’s look at a few examples while expanding nodes in SQL Server.
Example: Connect SQL Instance
Once we connect to a SQL Server instance, it logs that information in Object Explorer as shown below:
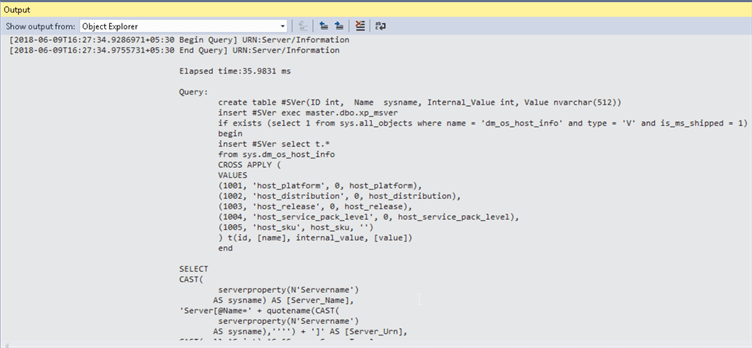
We can see the start of an event and it gives the below information:
- Begin Query event with timestamp and URN
- End Query event with timestamp and URN
- Elapsed time in milliseconds
- Query
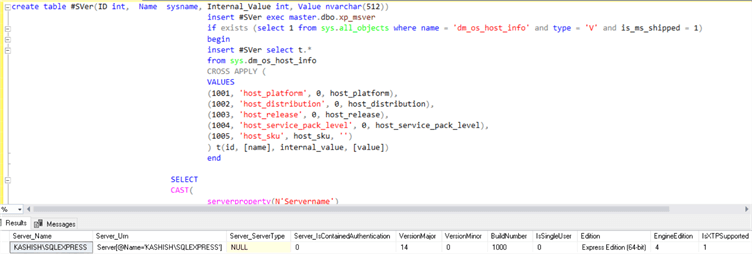
The URN (uniform resource name) refers to the underlying SQL Management Object and consists of an XPath-style hierarchy. We can copy the query and run it in SSMS as well to get detailed information.
create table #SVer(ID int,  Name  sysname, Internal_Value int, Value nvarchar(512))
insert #SVer exec master.dbo.xp_msver
if exists (select 1 from sys.all_objects where name = 'dm_os_host_info' and type = 'V' and is_ms_shipped = 1)
begin
insert #SVer select t.*
from sys.dm_os_host_info
CROSS APPLY (
VALUES
(1001, 'host_platform', 0, host_platform),
(1002, 'host_distribution', 0, host_distribution),
(1003, 'host_release', 0, host_release),
(1004, 'host_service_pack_level', 0, host_service_pack_level),
(1005, 'host_sku', host_sku, '')
) t(id, [name], internal_value, [value])
end
SELECT
CAST(
serverproperty(N'Servername')AS sysname) AS [Server_Name],
'Server[@Name=' + quotename(CAST(serverproperty(N'Servername')
  AS sysname),'''') + ']' AS [Server_Urn],
CAST(null AS int) AS [Server_ServerType],
0 AS [Server_IsContainedAuthentication],
(@@microsoftversion / 0x1000000) & 0xff AS [VersionMajor],
(@@microsoftversion / 0x10000) & 0xff AS [VersionMinor],
@@microsoftversion & 0xffff AS [BuildNumber],
CAST(SERVERPROPERTY('IsSingleUser') AS bit) AS [IsSingleUser],
CAST(SERVERPROPERTY(N'Edition') AS sysname) AS [Edition],
CAST(SERVERPROPERTY('EngineEdition') AS int) AS [EngineEdition],
CAST(ISNULL(SERVERPROPERTY(N'IsXTPSupported'), 0) AS bit) AS [IsXTPSupported],
SERVERPROPERTY(N'ProductVersion') AS [VersionString],
( select Value from #SVer where Name =N'host_platform') AS [HostPlatform],
CAST(FULLTEXTSERVICEPROPERTY('IsFullTextInstalled') AS bit) AS [IsFullTextInstalled]
ORDER BY
[Server_Name] ASC
drop table #SVer
Example: Expand Database Nodes
If we expand database nodes in SSMS to see the details of databases, the below query is logged in Object Explorer.

Here is the query:
SELECT
dtb.name AS [Database_Name],
'Server[@Name=' + quotename(CAST(  serverproperty(N'Servername')
AS sysname),'''') + ']' + '/Database[@Name=' + quotename(dtb.name,'''') + ']' AS [Database_Urn],
dtb.containment AS [Database_ContainmentType],
dtb.recovery_model AS [Database_RecoveryModel],
ISNULL(suser_sname(dtb.owner_sid),'') AS [Database_Owner],
case
when dtb.collation_name is null then 0x200
else 0
end |
case
when 1 = dtb.is_in_standby then 0x40
else 0
end |
case dtb.state
when 1 then 0x2
when 2 then 0x8
when 3 then 0x4
when 4 then 0x10
when 5 then 0x100
when 6 then 0x20
else 1
end
AS [Database_Status],
dtb.compatibility_level AS [Database_CompatibilityLevel],
ISNULL(dmi.mirroring_role,0) AS [Database_MirroringRole],
ISNULL(dmi.mirroring_state + 1, 0) AS [Database_MirroringStatus],
drs.database_guid AS [Database_DatabaseGuid],
CAST(
            case
           when SERVERPROPERTY('EngineEdition') = 6 then cast(1 as bit)
           else cast(0 as bit)
end
    AS bit) AS [Database_IsSqlDw],
   dtb.recovery_model AS [RecoveryModel],
   dtb.user_access AS [UserAccess],
   dtb.is_read_only AS [ReadOnly],
dtb.name AS [Database_DatabaseName2]
  FROM  master.sys.databases AS dtb
LEFT OUTER JOIN sys.database_mirroring AS dmi ON dmi.database_id = dtb.database_id
LEFT OUTER JOIN sys.database_recovery_status AS drs ON drs.database_id = dtb.database_id
WHERE
(CAST(case when dtb.name in ('master','model','msdb','tempdb') then 1 else dtb.is_distributor end AS bit)=0 and CAST(isnull(dtb.source_database_id, 0) AS bit)=0)
ORDER BY
[Database_Name] ASC
Example: Expand Security and Logins
When we expand the security section to view logins, the below information is logged.

Here is the query:
SELECT
log.name AS [Name],
'Server[@Name=' + quotename(CAST(serverproperty(N'Servername')
AS sysname),'''') + ']' + '/Login[@Name=' + quotename(log.name,'''') + ']' AS [Urn],
log.create_date AS [CreateDate],
CASE WHEN N'U' = log.type THEN 0 WHEN N'G' = log.type THEN 1 WHEN N'S' = log.type THEN 2 WHEN N'C' = log.type THEN 3 WHEN N'K' = log.type THEN 4 END AS [LoginType],
log.is_disabled AS [IsDisabled]
FROM
sys.server_principals AS log
WHERE
(log.type in ('U', 'G', 'S', 'C', 'K') AND log.principal_id not between 101 and 255 AND log.name <> N'##MS_AgentSigningCertificate##')
ORDER BY
[Name] ASC
Example: Viewing Error Logs
Here is the query:
create table #err_log_tmp(ArchiveNo int, CreateDate nvarchar(44), Size int)
insert #err_log_tmp exec master.dbo.sp_enumerrorlogs

SELECT
CAST(er.ArchiveNo AS sysname) AS [Name],
'Server[@Name=' + quotename(CAST(serverproperty(N'Servername')
AS sysname),'''') + ']' + '/ErrorLog[@ArchiveNo=''' + CAST(er.ArchiveNo AS sysname) + ''']' AS [Urn],
er.ArchiveNo AS [ArchiveNo],
CASE WHEN ISDATE(er.CreateDate) = 1 THEN CONVERT(datetime, er.CreateDate, 101) ELSE NULL END  AS [CreateDate]
FROM
#err_log_tmp er
ORDER BY
[ArchiveNo] ASC
drop table #err_log_tmp
This seems to be a very interesting feature and we can easily get the query to execute it manually to get the detailed data. It can also be useful for server performance analysis in cases where Object Explorer seems unusually slow to expand a particular node.
SQL Server Management Studio Telemetry Data
Another option is Telemetry, which is the stream of anonymous feature usage data collected by Microsoft. Microsoft collects these data as a feedback for their products. It is important for Microsoft to collect these data as part of their product enhancements and fixes.
During installation of SQL Server 2005 to 2012, we get the option whether we want feature usage and error reporting data to sent to Microsoft or not. We can simply ignore this box if we don’t want any data to be sent to Microsoft.
SQL Server Management Studio 2012 and 2014

In SQL Server 2014, we have the option to select whether we want to turn on the customer experience improvement program and error reporting to help improve the quality, reliability, and performance of SQL Server 2014. We can note here that the terms have changed in SQL Server 2014 compared to SQL Server 2012.

SQL Server Management Studio 2016 and 2017
In SQL Server 2016 and onwards, we don’t have a choice of selecting whether we want data to be sent or not. It just gives a message – SQL Server 2017 transmits information about your installation experience, as well as other usage and performance data, to Microsoft to help improve the product.

Therefore, by default, SQL Server 2016 and 2017 transmits information to Microsoft. We do have the option to disable later, but not during installation. We will cover this in another article.
Note: As per Microsoft Docs, Microsoft does not send any of the following types of information through this mechanism:
- Any values from inside user tables
- Any login credentials or other authentication information
- Personally Identifiable Information (PII)
Now, if we go to the Output window in SSMS and select telemetry, we can see the information logged as shown below:

If we run a query in SSMS, we can see only certain statistical information is logged in telemetry.

SQL Server Management Studio Activity Monitor New Options
Activity Monitor is a tool within SSMS to display information about SQL Server processes, CPU, Memory, etc. We can use this information to find out how these processes affect the current instance of SQL Server.

Once we launch Activity monitor, it opens up a new tabbed document window.

In SSMS 17.x once we launch ‘Activity Monitor’, we can also see new options as shown below.

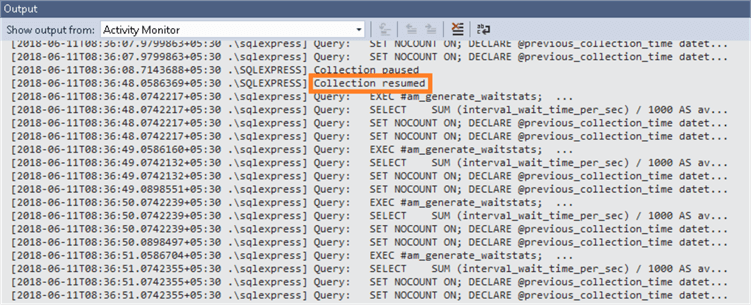
Activity Monitor shows part of the query text, timestamp and error messages.

This can be also useful to detect any issues with activity monitor. It also logs the activity monitor state, such as a pause.

Once the connection is resumed, we can see a similar entry:
The output window in SSMS offers up insight on background queries, processes even expanding various nodes. This is useful for when SSMS isn’t behaving as expected and we can use this tool to help identify potential issues by looking at the queries being executed. It is also useful to review the information that is being sent to Microsoft. Activity Monitor also provides additional information to look at.
Next Steps
- Explore the output window in SSMS 17.x and make use of it.
- Go through the New Features in SQL Server Management Studio v17.
- Explore more SQL Server 2017 tips.

Hi! I am Rajendra Gupta, Database Specialist and Architect, helping organizations implement Microsoft SQL Server, Azure, Couchbase, AWS solutions fast and efficiently, fix related issues, and Performance Tuning with over 14 years of experience.
I am the author of the book “DP-300 Administering Relational Database on Microsoft Azure.” I can be reached at: Rajendra.gupta16@gmail.com for any consulting help.
- MSSQLTips Awards:
- Author of the Year – 2022 | Author Contender – 2021/2023/2024 | Champion Award (100+ tips) – 2020


This is fantastic. I wasn’t aware of the output window and just how useful it was. I was looking for the query that SQL runs in the background to display some of the reports in Object Explorer Details and this is just what I needed