Problem
Reports are useful to organize data into summaries and grouping to quickly visualize the data. Sometimes having additional visual cues can be helpful to zoom on key sections of the report. In this tip, we will look at how to add conditional formatting to a SQL Server Reporting Services SSRS report to make reports even more useful.
Solution
Let’s take the following report as the basis for this tip. This report shows disk space for 2 servers, nothing elaborate, just the drives on each server and the space usage:

What if we could highlight certain areas of the data with different colors based on the free space? Let’s take a look at how this can be done.
Quick Overview to Add Conditional Formatting to a SSRS Report
Below is the sample report in Design view.

If you right click on an object you can look at the properties for the object as shown below. The properties window has an fx button next to almost all of the different properties. This indicates that we can set these values using formulas.

If you click one of the fx buttons, a new window appears where you enter the desired formula.

SSRS Conditional Formatting – Bold Text
For our first example, we will set the [Drive] field bold when the space is under 20%.
First, we right click the [Drive] field and select Text Box Properties:
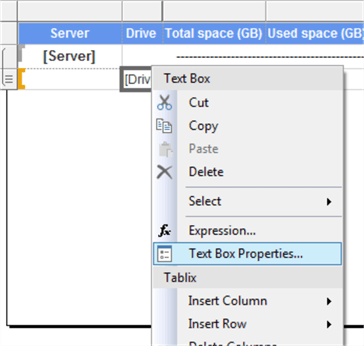
Then navigate to Font and click fx next to the Bold property:

In the formula window, we will put the following formula:
=IIf(Fields!pctFree.Value<0.2,"Bold","Default")
We use the IIf function that returns 2 values depending on the evaluation of an expression. In this case, our expression is to evaluate if the free space of a drive is under 20%. If true, it will return “Bold”, if false, it will keep the “Default” value:

Let’s see it in action. As you can see below, the drives under 20% of free space (F:, D: and Z:) are marked in bold:

SSRS Conditional Formatting – Text Background Color
For the next example, we will set the background color of the PctField, based on its value. A yellow color for values between 20% and 10% and a red color for values under 10%.
We select our [PctFree] field and open the properties. Navigate to the Fill tab and click the fx button next to the Fill color property:

In the formula window, put the following:
=Switch(Fields!pctFree.Value<0.1,"Tomato",Fields!pctFree.Value<0.2,"Gold")
Since there are multiple validations, we use the SWITCH function. This returns the value next to the evaluation if this is true, so if the first validation is true (space under 10%) it will return the “tomato” value and will exit. If false, it will evaluate the next expression (space under 20%) and if true, will return the “gold” value and will exit, if none of the evaluations are true, no background color is set:

Let’s see it in action. We can see the percent free field is highlighted based on its value:

SSRS Conditional Formatting – Chart Bar Colors
As you have seen, it is possible to set any property based on any value or formula, so setting properties for charts is also relatively easy.
Keep in mind that some of the fields for charts are summarized, so be careful with this so you do not have undesired results. Always check first if you need to summarize the fields in your formula.
So, for example if we want a color warning for the bar next to the value we will apply it to the Series Properties:
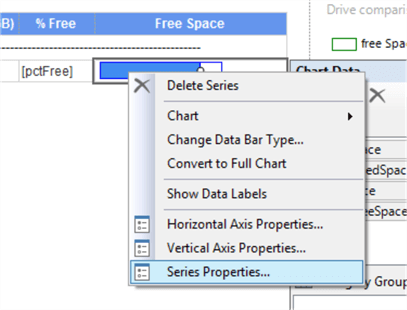
We select the fill color property and apply a formula like this:
=IIf(Fields!pctFree.Value<0.2,"Orange","Blue")
If the value is less than 20% it will be Orange otherwise it will be Blue.
Here are the results:

The last thing we want to do is to apply formatting to the other chart in our report.
We want the bar color as follows:
- Drives with space under 10% – Red
- Drives with space between 10% and 20% – Yellow
- Everything else – Green
We select the Series Properties for the Used Space:
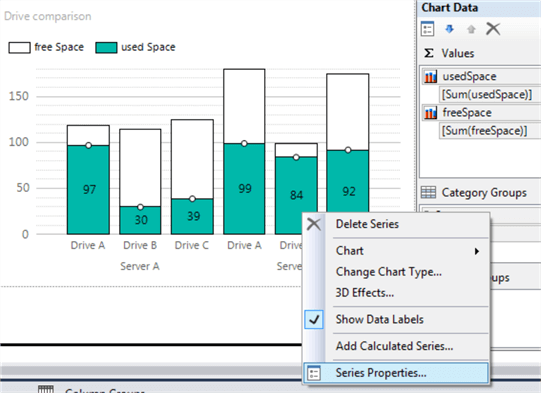
Then select the Fill tab and for the color property, click the fx button and enter the following formula:
=Switch(Fields!pctFree.Value<0.1,"Tomato",Fields!pctFree.Value<0.2,"Gold",true,"Green")
You can see the formula is the same as what we used for the second example, the only difference is that in the last check we put the constant true and a value of green. This is the equivalent of the ELSE sentence, it must be put at the end, because if you put it anywhere else, it will stop the evaluation.
Final Formatted Report
Below we can see the final report with all the formats we applied.
Next Steps
- SQL Server Data Tools (SSDT) is the tool provided by Microsoft to develop Reporting Services, Analysis Services and Integration Services solutions in a Visual Studio like environment, you can download the latest version from here.
- This custom formatting is only available for .RDL paginated reports. These features are not available in Power BI. Please take this into consideration if you plan to migrate your reports from SSRS to Power BI.
- We focused mostly on color properties, but you can customize any property that has an fx button next to it, so create a test report with dummy data and try to modify and apply formulas to different properties and on different controls. This will help you create professional looking reports.

Eduardo Pivaral is an MCSA, SQL Server Database Administrator and Developer with over 15 years of experience working in large environments.
- MSSQLTips Awards: Trendsetter (25+ tips) – 2020 | Author of the Year Contender – 2019 | Rookie of the Year – 2018
Excellent contribution. Is it possible that you can share the rdl created in your explanation? Thank you.
Thank you! This is exactly what I was looking for