Problem
In large environments, where you have large OLTP databases, deadlocks are a common issue. It is imperative to identify and resolve the SQL Server Deadlocks to guarantee business continuity with no user interruptions. Even when you can identify deadlocks using trace flags or Profiler, Extended Events provide us the ability to monitor and capture deadlock events and related information in a lightweight and customizable way. Also, Extended Events are meant to replace SQL Server Profiler as it is deprecated.
If you use trace flags, you can easily forget you have them configured on the server and if a migration/server rebuild occurs you can forget to configure them, especially for servers handed over to your team.
Solution
Extended Events were introduced in SQL Server 2008, so you will not have any issue implementing them in your environment. In this tip, we will learn how to capture deadlock information using Extended Events and review the captured data.
Creating SQL Server Extended Events to Capture Deadlocks using Management Studio
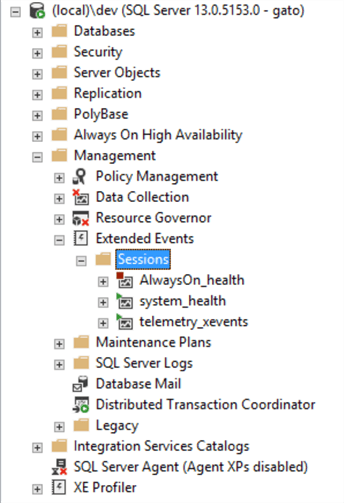
First, open SQL Server Management Studio (SSMS) and navigate to Management > Extended Events > Sessions.
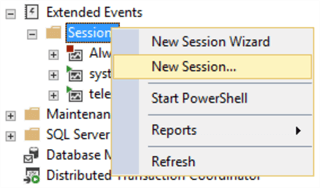
Right-click on Sessions and select New Session.
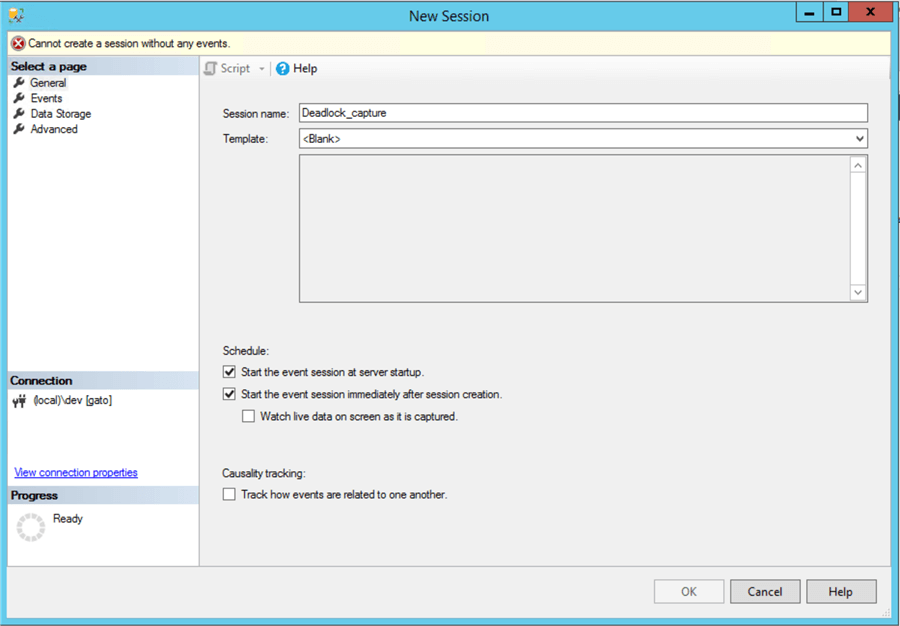
In the new window, enter a name for your event, we will use Deadlock_Capture for this example. Select the event to start at server startup and after session creation, you can change these options if you want.
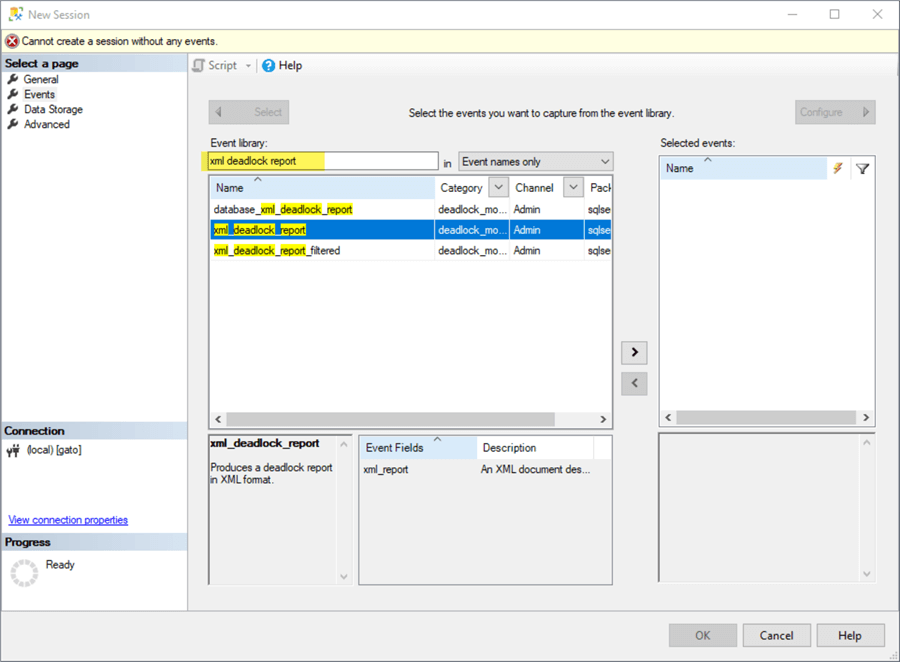
Then go to the Events tab and in the event library textbox type “deadlock” to filter deadlock events:

For this tip, we will select 2 events: Lock_Deadlock (Occurs when an attempt to acquire a lock is canceled for the victim of a deadlock) and Lock_deadlock_chain (Occurs when an attempt to acquire a lock generates a deadlock. This event is raised for each participant in the deadlock).

With both events selected, click on the configure button, and a new window will appear, in this window, we will capture the sql_text field to be able to see the query that caused the deadlock:

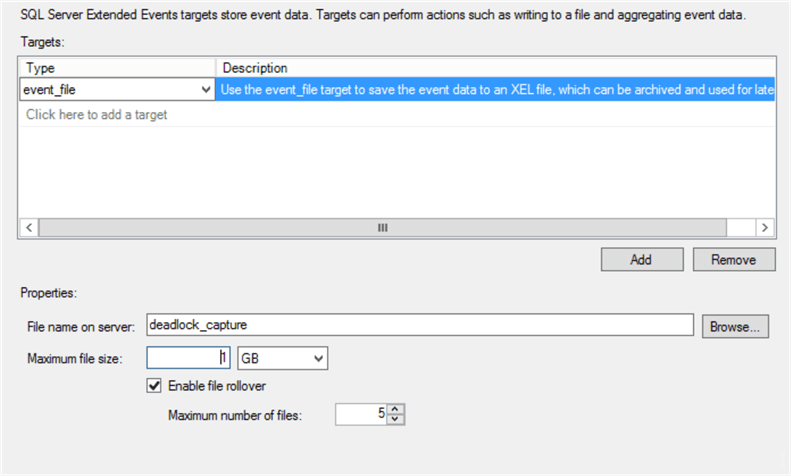
In the Data Storage tab, select where you want to store the Extended Event data, I prefer to use a file:

I leave the defaults and it should look something like this:
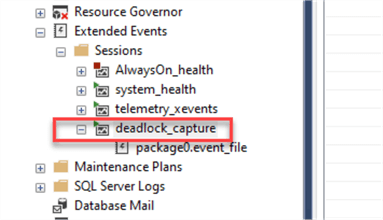
After that, click on OK to save the Event configuration, we can see that the event is created and is already running:

Create SQL Server Extended Events to Capture Deadlocks using T-SQL
You can achieve the same results as we demonstrated in SQL Server Management Studio by executing the following T-SQL code. In the comments of the code, I briefly explain the purpose of each section.
--Event Session
CREATE EVENT SESSION [deadlock_capture] ON SERVER
--Events to track Lock_deadlock and Lock_deadlock_chain
ADD EVENT sqlserver.lock_deadlock(
    ACTION(sqlserver.sql_text)),
ADD EVENT sqlserver.lock_deadlock_chain(
    ACTION(sqlserver.sql_text))
-- TARGET to use, for this case, a file
ADD TARGET package0.event_file(SET filename=N'deadlock_capture')
--The event session advanced parameters, you can see that the event starts automatically
WITH (MAX_MEMORY=4096 KB,EVENT_RETENTION_MODE=ALLOW_SINGLE_EVENT_LOSS,MAX_DISPATCH_LATENCY=30
SECONDS,MAX_EVENT_SIZE=0 KB,MEMORY_PARTITION_MODE=NONE,TRACK_CAUSALITY=OFF,STARTUP_STATE=ON)
GO
Now our event to capture deadlocks is created, it is just a matter of testing it.
Testing SQL Server Extended Events with a Deadlock
Creating a deadlock for testing purposes is very simple, all you need is 2 tables and 2 sessions. In this example, we are updating the same record on each table for each session with open transactions.
In session 1 run this query (use any test table you want):
BEGIN TRAN
UPDATE tableA
set [value] = 'C1'
WHERE id = 1
WAITFOR DELAY '00:00:05'
UPDATE tableB
set [value] = 'C2'
WHERE id = 1
Then after a few seconds run the below code in session 2 (we just changed the update order):
BEGIN TRAN
UPDATE tableB
set [value] = 'C2'
WHERE id = 1
WAITFOR DELAY '00:00:05'
UPDATE tableA
set [value] = 'C1'
WHERE id = 1
One of the sessions will throw a message like this:
Transaction (Process ID 56) was deadlocked on lock resources with another process and has been
chosen as the deadlock victim. Rerun the transaction.
After that, you can just commit or rollback the transaction that did not fail.
Of course, in a real-world scenario, you will not be monitoring each user session in real-time, that is why we created the Extended Event to capture this information for later analysis.
Now let’s check how this deadlock was captured.
Reviewing Data Captured by SQL Server Extended Events
Using SSMS, navigate to Management > Extended Events > Sessions, and expand the event you want to check the data (deadlock_capture for our example), then double click on the target you want to check:

You can see the captured data so far, I filtered the data by date so you just see the test we did earlier:

What the captured data tells us?
- The lock_deadlock_chain events tell us both sessions involved in the deadlock, as you can see by clicking on any of them to see the details, for our example were sessions 53 and 56:

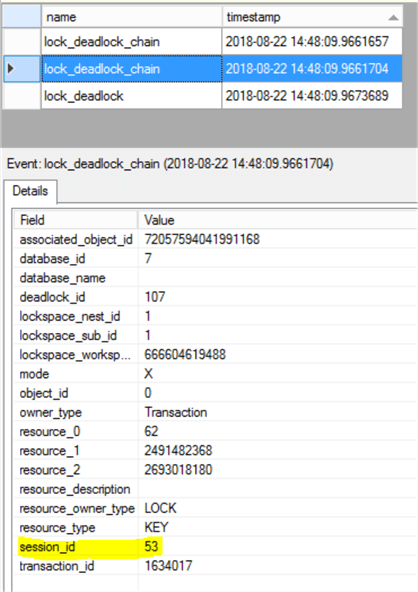
- The lock_deadlock event provides us the information about the deadlock victim, with the T-SQL code involved as well, we can correlate it to the session_id using the transaction_id field:

With this info, you can create and analyze deadlocks in your database server.
What if you need more information?
There are cases where troubleshooting deadlocks can be problematic, maybe because of the complexity of the queries or because there are more than two sessions involved in the deadlocks. In that case, you can use the xml deadlock report, which allows you to visually analyze the deadlock and have a better understanding of the issue.
Please note: using this event can be more resource intensive since more data must be captured and stored, so use only in situations where is strictly necessary, and try to filter it whenever possible.
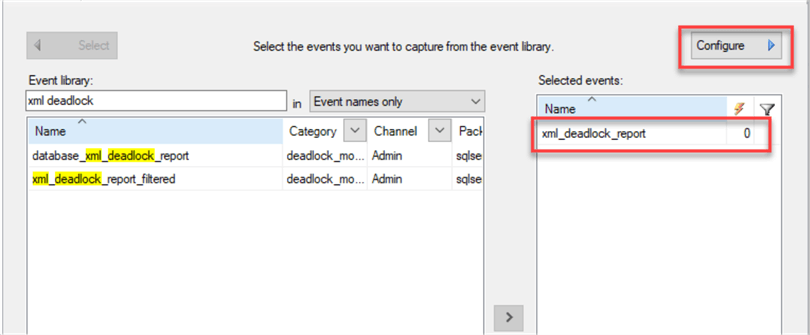
To configure, repeat the same steps we did before using SSMS but this time select the xml_deadlock_report option (feel free to experiment with the other options):
Once selected, you can click on Configure to add additional fields or filter the event, in our case we will not select any other field or filter. Also, we will not select sql_text this time since is already included in the deadlock report event.
Once done, click OK and we are ready for testing.
In case you want the T-SQL definition for this event, here it is:
CREATE EVENT SESSION [deadlock_capture] ON SERVER

ADD EVENT sqlserver.xml_deadlock_report

ADD TARGET package0.event_file (SET filename = N'deadlock_capture')
    WITH (
            MAX_MEMORY = 4096 KB
            , EVENT_RETENTION_MODE = ALLOW_SINGLE_EVENT_LOSS
            , MAX_DISPATCH_LATENCY = 30 SECONDS
            , MAX_EVENT_SIZE = 0 KB
            , MEMORY_PARTITION_MODE = NONE
            , TRACK_CAUSALITY = OFF
            , STARTUP_STATE = OFF
            )
GO
We can test again using the same test query as before.

Now, if we check the extended event data, we will be able to see the deadlock report entry:
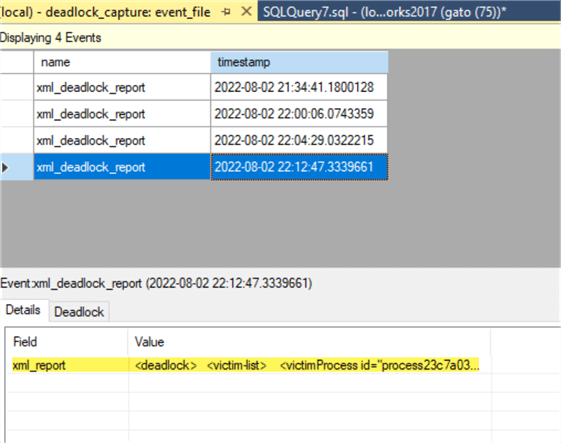
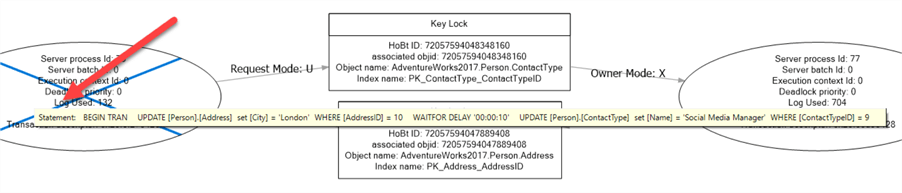
If you select one of these deadlock report entries and click on the Deadlock tab, you will be able to analyze it visually:

You can hover the mouse over the various objects to get additional details as shown below:
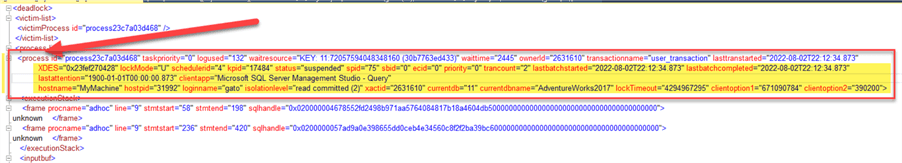
You can also open the XML in case you need to look for specific details of the session (host name, application name, client app, isolation level, etc.)
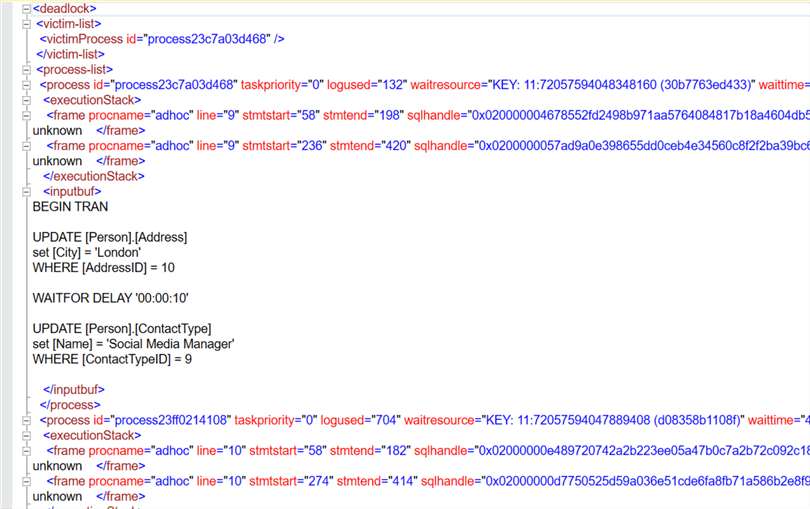
Those details are found in the <process> tag (I added a few ENTERs to make it easier to read each entry, but you can scroll right to look for the information):
My Extended Event is Not Capturing Any Data!
In the case you are not seeing data after your test, aside from any restrictive filter you could have created, make sure the event is started (it should have a green triangle next to it).
If it is not started (you see a red square), you can start it by right-clicking on it and choosing Start Session:

If you need to do it programmatically, you read my other tip on how to start and stop XE events via T-SQL code and using SQL Agent jobs.
Next Steps
- SQL Server introduced Extended Events in SQL Server 2008, they were meant to replace SQL Server Profiler traces and they provide a lightweight, customizable event collection platform.
- You can use the example I provided as a base and customize it by adding other fields you might need (for example: capturing the user, hostname, etc.)
- Check out the Microsoft official documentation about Extended Events.

Eduardo Pivaral is an MCSA, SQL Server Database Administrator and Developer with over 15 years of experience working in large environments.
- MSSQLTips Awards: Trendsetter (25+ tips) – 2020 | Author of the Year Contender – 2019 | Rookie of the Year – 2018


I think the pre-installed [system_health] session already contains deadlock events – doesn’t it?
Hi Christian,
This is a basic guide, and the output is a simple SELECT query, so you can add/remove columns you need, you can freely remove the columns you don’t need.
The objective of this tip is to show which events we should capture for deadlocks… the information (more or less) you need to collect is up to you.
Help a bit to understand the Extended Events but the end result is not so good.
What does the transaction_id and session_id does for us? It doesn’t give any pertinent details.
Then this: “With both events selected, click on the configure button, and a new window will appear, in this window we will capture the sql_text field to be able to see the query that caused the deadlock”. You are aware that sql_text won’t show up for lock_deadlock_chain? The only informations you can get in sql_text is the one of the process which got killed.
if deadlock found, use effective resolving techniques. Try to access objects in a similar logical manner in multiple transactions Try to analyze the queries involved in the DL, check corresponding xml of the deadlock also xdl file if needed and with given information go back to the db and look for effective techniques. DO NOT blindly create indexes for every deadlock. Apply your performance improvement skills on these queries too wherever needed.
Create a covering index to reduce the possibility of a deadlock.
Great tip! As much as I hate to admit it, I’ve never used extended event sessions but am looking to get additional information on deadlocks we’re seeing in one of our databases and this tip gave me everything I needed to set one up. Thanks!