Problem
We have a lot of time-series data stored in our SQL Servers. Our analysts are looking for a simple way to make sense of this data. Is there any good tool for this? We don’t have the budget for a commercial product at the moment.
Solution
Grafana is an open source visual data analysis, monitoring and dashboarding tool from Grafana Labs. It can connect to many different data source – including SQL Server – and run advanced analytic queries on time series data. It’s used by some of the well-known names in the industry like eBay, PayPal, NetApp, Uber and Redhat.
In this tip, we are going to install Grafana in local workstation and run analytic queries on time series data stored in a SQL Server. Before that, let’s understand what time-series data is.
What’s Time Series Data
Time series data is a sequence of data values corresponding to a series of points in time where the points are usually spaced equally apart. The data can be a single metric, or a collection of metrics. Either way, the data is a function of time: a single data value represents the state of a system at a specific point in time.
In today’s world, time series data is everywhere. Here are some examples:
- Weather APIs provide data about temperature, humidity or rainfall over a period of time in the past or future. This data may be reported for every hour or every three-hours.
- Smart home devices collect a large number of home related metrics such as electricity consumption every minute or every half-hour.
- Self-driving smart cars continuously collect information about outside driving conditions.
- Automated stock market systems collect and store information about stock prices.
Another example of time series data more common for DBAs or developers is SQL Server performance counters from Dynamic Management Views (DMVs).
What’s common in all these examples is that time is always the unchanging dimension. In other words, time can be always plotted against an imaginary X axis of a chart and the data values plotted against Y.
Time series data is usually high velocity in nature. Specialized databases like InfluxDB or Cassandra are best choices for storing it. Another characteristic of time series data is that it’s not overwritten with the flow of time: in other words, there are no UPDATEs or DELETEs when time series data is stored, only INSERTs.
In this tip, we will work with a static time series dataset stored in SQL Server.
Sample Dataset: Down Jones Index
Our sample dataset is a list of stock indexes from Dow Jones and how they performed over a few months in 2011. The data is available from the University of California, Irvine’s Machine Learning Repository. It was donated by Dr. Michael Brown from the University of Maryland’s University College.
As part of the usage permission, UCI also asks us to mention the following paper which is based on this dataset: Brown, M. S., Pelosi, M. & Dirska, H. (2013). Dynamic-radius Species-conserving Genetic Algorithm for the Financial Forecasting of Dow Jones Index Stocks. Machine Learning and Data Mining in Pattern Recognition, 7988, 27-41
The dataset has 750 rows and a number of columns. It comes in two files:
- one file containing the description of the indexes (dow_jones_index.names)
- one file containing the actual stock values (dow_jones_index.data).
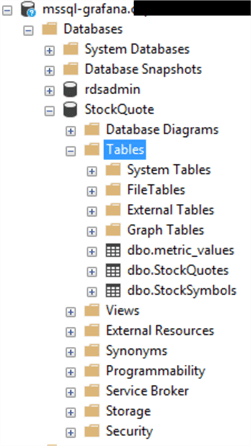
The SQL Server Database
To load this data, we created a database called “StockQuote” in a SQL Server 2017 instance in Amazon RDS. Three tables were created in the database:
- StockSymbols
- StockQuotes_Staging and
- StockQuotes
Here is the script for creating the tables:
SET NOCOUNT ON;

USE StockQuote;
GO

IF EXISTS (SELECT * FROM sys.tables WHERE name = 'StockQuotes')
   DROP TABLE dbo.StockQuotes;
GO
IF EXISTS (SELECT * FROM sys.tables WHERE name = 'StockSymbols')
   DROP TABLE dbo.StockSymbols;
GO
IF EXISTS (SELECT * FROM sys.tables WHERE name = 'StockQuotes_Staging')
   DROP TABLE dbo.StockQuotes_Staging;
GO
CREATE TABLE StockQuote.dbo.StockSymbols (
   StockSymbol varchar(10) PRIMARY KEY,
   ActualName  varchar(50)
);
GO

CREATE TABLE StockQuote.dbo.StockQuotes_Staging (
   "Quarter"                           varchar(10),
   StockSymbol                         varchar(10),
   LastBusinessDateWeek                varchar(20) NULL,
   StockOpeningPriceWeek               varchar(20) NULL,
   StockHighestPriceWeek               varchar(20) NULL,
   StockLowestPriceWeek                varchar(20) NULL,
   StockClosingPricesWeek              varchar(20) NULL,
   StockVolumeTradedWeek               varchar(20) NULL,
   StockPricePercentChangedWeek        varchar(20) NULL,
   StockVolumeTradedPercentChangedWeek varchar(20) NULL,
   StockVolumeTradedLastWeek           varchar(20) NULL,
   StockOpeningPriceNextWeek           varchar(20) NULL,
   StockClosingPricesNextWeek          varchar(20) NULL,
   StockPricePercentChangedNextWeek    varchar(20) NULL,
   DaysToNextDividend                  varchar(20) NULL,
   StockPercentReturnedNextDividend    varchar(20) NULL
);
GO

CREATE TABLE StockQuote.dbo.StockQuotes (
   [Quarter]                           tinyint,
   StockSymbol                         varchar(10),
   LastBusinessDateWeek                datetime      NULL,
   StockOpeningPriceWeek               decimal(15,5) NULL,
   StockHighestPriceWeek               decimal(15,5) NULL,
   StockLowestPriceWeek                decimal(15,5) NULL,
   StockClosingPricesWeek              decimal(15,5) NULL,
   StockVolumeTradedWeek               bigint        NULL,
   StockPricePercentChangedWeek        decimal(15,5) NULL,
   StockVolumeTradedPercentChangedWeek decimal(25,5) NULL,
   StockVolumeTradedLastWeek           bigint        NULL,
   StockOpeningPriceNextWeek           decimal(15,5) NULL,
   StockClosingPricesNextWeek          decimal(15,5) NULL,
   StockPricePercentChangedNextWeek    decimal(15,5) NULL,
   DaysToNextDividend                  smallint      NULL,
   StockPercentReturnedNextDividend    decimal(15,5) NULL

   CONSTRAINT FK_StockSymbol FOREIGN KEY(StockSymbol) REFERENCES StockSymbols(StockSymbol)
   )
GO
SET NOCOUNT OFF;
We populated the StockSymbols table with data from the original file:
INSERT INTO dbo.StockSymbols(StockSymbol,ActualName) VALUES('MMM','3M');
INSERT INTO dbo.StockSymbols(StockSymbol,ActualName) VALUES('AXP','American Express');
INSERT INTO dbo.StockSymbols(StockSymbol,ActualName) VALUES('AA','Alcoa');
INSERT INTO dbo.StockSymbols(StockSymbol,ActualName) VALUES('BAC','Bank of America');
INSERT INTO dbo.StockSymbols(StockSymbol,ActualName) VALUES('CAT','Caterpillar');
INSERT INTO dbo.StockSymbols(StockSymbol,ActualName) VALUES('CVX','Chevron');
INSERT INTO dbo.StockSymbols(StockSymbol,ActualName) VALUES('CSCO','Cisco Systems');
INSERT INTO dbo.StockSymbols(StockSymbol,ActualName) VALUES('KO','Coca-Cola');
INSERT INTO dbo.StockSymbols(StockSymbol,ActualName) VALUES('XOM','ExxonMobil');
INSERT INTO dbo.StockSymbols(StockSymbol,ActualName) VALUES('T','AT&T');
INSERT INTO dbo.StockSymbols(StockSymbol,ActualName) VALUES('BA','Boeing');
INSERT INTO dbo.StockSymbols(StockSymbol,ActualName) VALUES('DD','DuPont');
INSERT INTO dbo.StockSymbols(StockSymbol,ActualName) VALUES('HD','The Home Depot');
INSERT INTO dbo.StockSymbols(StockSymbol,ActualName) VALUES('INTC','Intel');
INSERT INTO dbo.StockSymbols(StockSymbol,ActualName) VALUES('IBM','IBM');
INSERT INTO dbo.StockSymbols(StockSymbol,ActualName) VALUES('HPQ','Hewlett-Packard');
INSERT INTO dbo.StockSymbols(StockSymbol,ActualName) VALUES('MCD','McDonald''s');
INSERT INTO dbo.StockSymbols(StockSymbol,ActualName) VALUES('MRK','Merck');
INSERT INTO dbo.StockSymbols(StockSymbol,ActualName) VALUES('KRFT','Kraft');
INSERT INTO dbo.StockSymbols(StockSymbol,ActualName) VALUES('JPM','JPMorgan Chase');
INSERT INTO dbo.StockSymbols(StockSymbol,ActualName) VALUES('JNJ','Johnson & Johnson');
INSERT INTO dbo.StockSymbols(StockSymbol,ActualName) VALUES('GE','General Electric');
INSERT INTO dbo.StockSymbols(StockSymbol,ActualName) VALUES('MSFT','Microsoft');
INSERT INTO dbo.StockSymbols(StockSymbol,ActualName) VALUES('PFE','Pfizer');
INSERT INTO dbo.StockSymbols(StockSymbol,ActualName) VALUES('PG','Procter & Gamble');
INSERT INTO dbo.StockSymbols(StockSymbol,ActualName) VALUES('TRV','Travelers');
INSERT INTO dbo.StockSymbols(StockSymbol,ActualName) VALUES('UTX','United Technologies');
INSERT INTO dbo.StockSymbols(StockSymbol,ActualName) VALUES('VZ','Verizon');
INSERT INTO dbo.StockSymbols(StockSymbol,ActualName) VALUES('WMT','Wal-Mart');
INSERT INTO dbo.StockSymbols(StockSymbol,ActualName) VALUES('DIS','Walt Disney');
Next, we used the SQL Server Data Import and Export Wizard to populate the StockQuotes_Staging table with the dow_jones_index.data file. We had to a do a bit of data preparation after the initial load such as:
- Removing all “$” symbols
- Updating blank fields with NULs
UPDATE StockQuote.dbo.StockQuotes_Staging
SET    StockVolumeTradedPercentChangedWeek = NULL
WHERE  StockVolumeTradedPercentChangedWeek = '';

UPDATE StockQuote.dbo.StockQuotes_Staging
SET    StockVolumeTradedLastWeek = NULL
WHERE  StockVolumeTradedLastWeek = '';
After that, we used the Data Import and Export wizard to copy the staged data into StockQuotes table.
Let’s go through the StockQuotes table’s fields and see what type of data they contain.
| Field Name | Content |
|---|---|
| Quarter | The quarter of the year (e.g. 1 = January to March, 2 = April – June) |
| StockSymbol | The stock symbol. The actual company name is listed in the StockSymbols table. |
| LastBusinessDateWeek | Last business day of the current week. We will use this as the main time field of the dataset. |
| StockOpeningPriceWeek | Opening price of the stock in current week |
| StockHighestPriceWeek | Highest price of the stock in current week |
| StockLowestPriceWeek | Lowest price of the stock in current week |
| StockClosingPricesWeek | Closing price of the stock in current week (Closing price measured on the LastBusinessDateWeek of current week) |
| StockVolumeTradedWeek | Number of stocks traded in current week |
| StockPricePercentChangedWeek | Percentage change in stock price in current week |
| StockVolumeTradedPercentChangedWeek | Percentage change in number of stocks traded in current week |
| StockVolumeTradedLastWeek | Number of stocks traded in previous week |
| StockOpeningPriceNextWeek | Opening price of the stock in following week |
| StockClosingPricesNextWeek | Closing price of the stock in following week (Closing price measured on the LastBusinessDateWeek of following week) |
| StockPricePercentChangedNextWeek | Percentage change in stock price in following week |
| DaysToNextDividend | Number of days remaining to the next dividend |
| StockPercentReturnedNextDividend | Percentage of return on the next dividend |
You can see the only time field here is LastBusinessDateWeek, the rest contains numeric data. We will use this field along the X-axis of our Grafana charts.
Installing Grafana
Grafana can be downloaded for multiple platforms including Linux, MacOS and Windows. It’s also available as a Docker container. Since it does not have to run on a server, data analysts can install it on their local machines and start analyzing data. For production-grade workload though, it’s best to run Grafana on a server with some extra configuration. There’s also a paid version of Grafana Enterprise and a cloud-hosted solution.
We installed the latest version of Grafana on both a MacBook Pro and a Windows 10 laptop. The installation is fairly simple. Once the archived package in unzipped, users need to make a copy of the sample configuration file and make any changes to the newly copied file. For Windows, the sample.inifile in the installation directory was copied as custom.ini. However, no changes were made to the custom.ini file.
We decided to create a separate user account in SQL Server for Grafana. The following code block shows how the user account was created and granted read-only permission in the StockQuote database.
CREATE LOGIN grafanareader WITH PASSWORD '<complex-password>'
GO
USE StockQuote
GO
CREATE USER grafanareader FROM LOGIN grafanareader
GO
GRANT SELECT ON SCHEMA::dbo TO grafanareader
GO
GRANT SELECT ON dbo.StockSymbols TO grafanareader
GO
GRANT SELECT ON dbo.StockQuotes_Staging TO grafanareader
GO
GRANT SELECT ON dbo.StockQuotes TO grafanareader
GO
Grafana in Windows can be manually started by running the grafana-server.exe file. However, we wanted to run it as a service. So we used a free Windows application called NSSM (Non-Sucking Service Manager) to create this service.


Once the service was running, Grafana could be accessed through a web browser. We navigated to the local machine address: http://localhost:3000
Here, 3000 is the default port for Grafana, although it can be changed in the configuration file. The opening page prompted us for a username and password:

The default username and password for initial login are admin and admin. Once the credentials were provided, Grafana prompted to change the password:

Once the password was changed, the main interface came up.
A Quick Tour of Grafana
After a fresh install, the Grafana “Home Dashboard” looks like this:

Unless a data source is created, the prompt for adding a data source is highlighted.
Clicking on the database icon opens up the data source configuration screen. Some common data source types are listed in the first page:

In the search box, we typed “SQL”, and the data source icon for Microsoft SQL Server came up (along with MySQL and PostgreSQL):
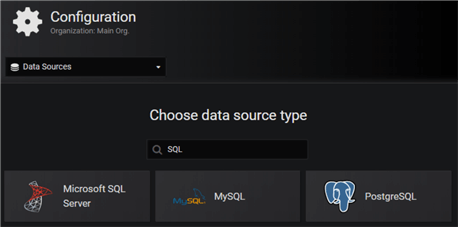
Clicking on the Microsoft SQL Server icon brought up the data source settings screen:

In this screen, we specified:
- A meaningful name for our data source (we named it “SQLServer-Grafana)
- The SQL Server host address
- The database name
- A user name and password for the connection (we are using the Grafana reader account here)
All other fields can be left blank. Here:
- Max open is the maximum allowed number of open connections to the database from Grafana.
- Max idle is the maximum number of connections in the idle connection pool in Grafana.
- Max lifetime is the maximum time in seconds a Grafana connection may be reused. If it is set to 0, connections are reused forever.
Once the details are filled in, clicking on the “Save and Test” button tests the database connection, and if successful, creates it.
Exploring Data with Grafana
With a connection to the database created, we wanted to see how the Dow Jones data looked. We clicked the Explore menu option in the main navigation bar on the left.

This presented us the Explore screen. We selected the database connection we created before and wrote the following query in the query window:
SELECT
   LastBusinessDateWeek as time,
   StockSymbol as "metric",
   StockHighestPriceWeek,
   StockLowestPriceWeek
FROM
   StockQuote.dbo.StockQuotes
WHERE
   StockSymbol = 'MSFT'
   AND $__timeFilter(LastBusinessDateWeek)
ORDER BY 1
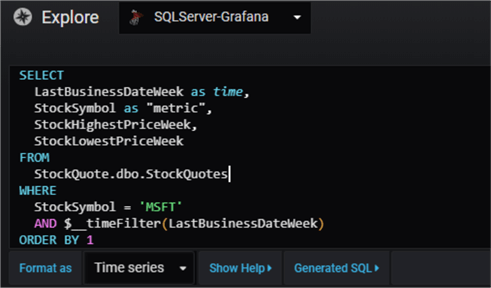
Note how we are using a Grafana specific function $__timeFilter here. Grafana comes with a number of functions like this. These functions are used for calculating time series data. This particular function changes the LastBusinessDateWeek column into a time range filter. That means the WHERE clause after the AND operator becomes something like
LastBusinessDateWeek BETWEEN <start date> AND <end date>
Also note how we had to alias the actual date field as “time”. This is required by Grafana.
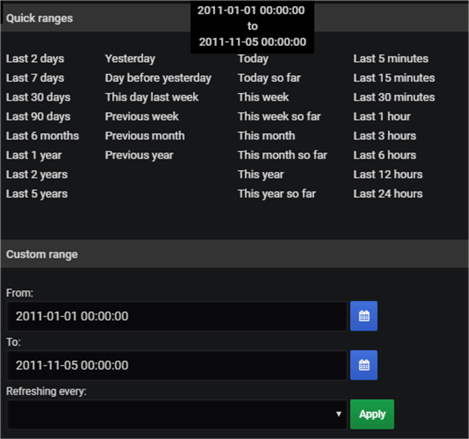
We selected the “Format as” field to “Time series” and selected a date range from the date picker in the top right corner of the screen. The date range in this case was between 1 January 2011 and 30 November 2011.
Clicking the “Run Query” button near the query window immediately created a line graph. The graphical representation showed Microsoft (MSFT) stock performance during the chosen period:

From the chart, we could see there was a big drop in Microsoft share prices in a week somewhere between June and July 2011.
The table below the chart showed the raw values returned by the query. Note how date values were converted to Unix epoch values.

Creating a Grafana Dashboard
After exploring the index data trend, we decided to build a dashboard with similar queries. The dashboard would show similar index performance over the same period for different companies. Before we talk about that, let’s understand the basic building block: Grafana panels.
Panels
In Grafana, dashboards are made of “panels”. A panel is what other systems would call a “widget”. It’s basically a single piece of visualization that shows one or more metrics in it. Like any good monitoring tool, Grafana allows dragging and rearranging panels in a dashboard.
Each panel has its own query editor, so it can show its own visual representation of data it selects. A panel can make use of one of the following types of visualizations:

Panels can also be made more dynamic by using templating variables and using those variables in the panel’s query. The time range for a panel usually defaults to the time range of the dashboard, although this can be overridden in the panel’s time picker.
Analyzing Dow Jones Index Data from the Dashboard
We created a blank dashboard by selecting the Create > Dashboard option from the main navigation bar on the left:

This presented us with a blank dashboard with a single panel. We clicked the “Add Query” icon in the new panel:

This brought up a query panel. We selected our data source from the panel and wrote the following query:
SELECT
   a.LastBusinessDateWeek AS time,
   b.ActualName AS [Metric],
   a.StockHighestPriceWeek,
   a.StockLowestPriceWeek
FROM
   StockQuote.dbo.StockQuotes a
   INNER JOIN
      StockQuote.dbo.StockSymbols b
      ON a.StockSymbol = b.StockSymbol
WHERE
   a.StockSymbol = 'MSFT'
   AND $__timeFilter(a.LastBusinessDateWeek)
ORDER BY 1

This query is almost the same as before, except it’s joining two tables to get the actual company name from the index.
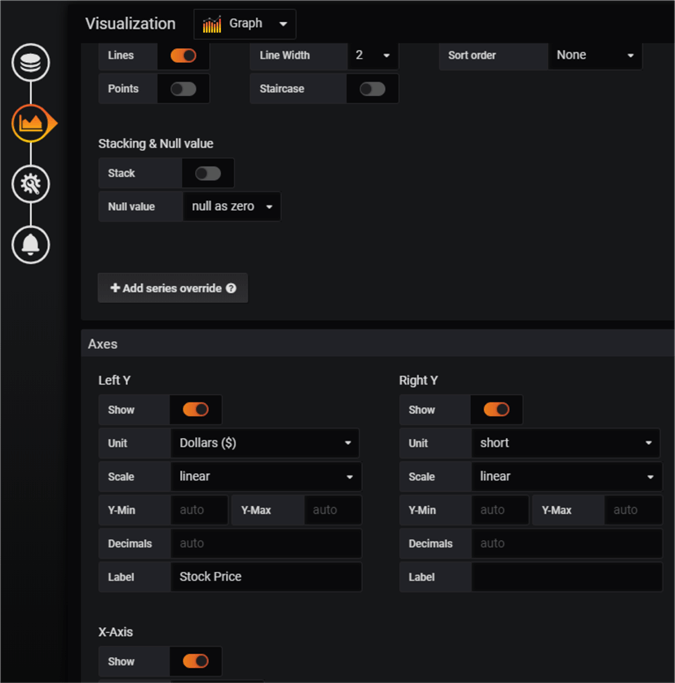
Next, from the visualization tab we chose the style as Graph and changed a few parameters there. For example, we changed the Y axis unit to currency, gave it a label and made the graph line width 2 units thick:
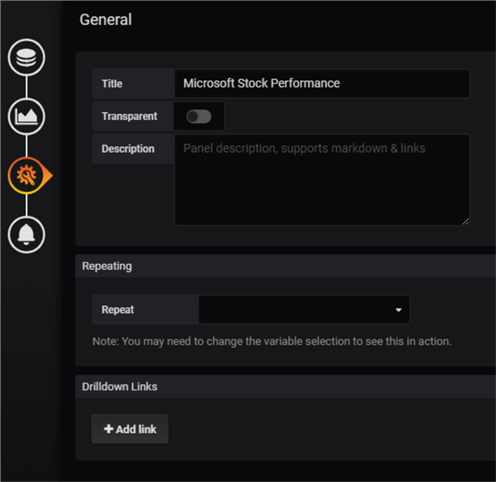
From the general tab, we changed the panel’s title:
We did not want to add any alerting to this panel so left the last tab.
Going back to the dashboard, we changed the time range between 1 January 2011 and 30 November 2011:

The first panel we created now showed Microsoft stock performance:

Similar queries were used to build three more panels for stock symbols ‘IBM’, ‘CSCO’ and ‘INTC’:


We could have used templated queries, but this was a quick way to build the dashboard.
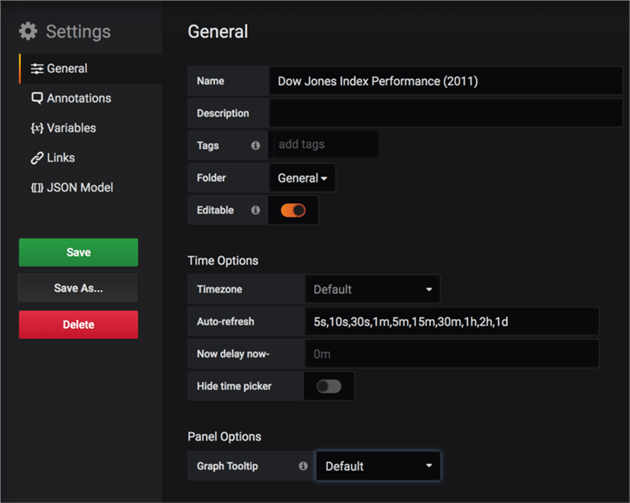
The dashboard was given a meaningful name (“Dow Jones Index Performance (2011)”) from the General Settings window:
Finally, we saved the dashboard which was now showing the stock performance of four major IT vendors:

Hovering the mouse pointer over one of the panels also moved the red needle over other panels.
Looking at the above picture, the first thing that caught our eyes was the dip in some of the stocks in the week of September 1. On that particular day, the difference between the highest weekly price and the lowest weekly price of the stock was small ($1 or so). However, for IBM and Intel, the highest stock price had taken a hit compared to the highest stock price in the week before. In comparison, Microsoft and Cisco had a gain in their highest stock prices.
This was a simple analysis, but it was possible with only a few minutes of tweaking with Grafana.
Other Grafana Features
Other notable features of Grafana include:
Alerting
Grafana allows setting up alerts. With alerting, when a metric crosses a specified threshold, Grafana sends out a message to one or more recipients – just like any regular monitoring tool. Alerts can be configured from a dashboard or panel’s Alert tab.

Alert response can be sent to a notification channel:

Notifications can be configured from the Alert tab of the main Grafana console. The image below shows Grafana supports a wide variety of notification channels.

Panel and Dashboard Sharing
Panel or dashboards can be shared with other users of the same Grafana instance or outside users. Dashboard share menu is available from the top menu bar in a dashboard:

Panels can be shared from the panel’s header menu:

The interface looks the same in both cases:

Users who receive a shared link can click on it to navigate to the dashboard or panel with the current selected time range and template variables. This will work for users who have access to the Grafana instance.
Another way of publicly sharing a dashboard is to create snapshot of it. When Grafana creates a snapshot, it strips it of all sensitive data such as embedded links, queries or annotations and leaves only the visible metric data and series names embedded in the dashboard. Snapshots can be created locally or hosted in a site like raintank. For local snapshots, again, users need to have access to the Grafana server.

Finally, exporting a dashboard will save its definition in a JSON file which can be imported back into another Grafana instance.

Conclusion
This was a very high-level introduction to Grafana. However, we saw how easy it was to create meaningful insight from time-series data in SQL Server. We recommend readers familiarize themselves with Grafana SQL Server documentation and learn more about:
- Grafana macros: Macros are essential for writing effective queries
- Templating and Query variables: These can help avoid hard-coding queries values
- Annotations: Annotations allow users to add extra information to a graph. When the mouse pointer is hovered over an annotated point, the annotated text and tags are displayed.
- Stored procedure support: Grafana supports SQL Server stored procedure calls, but the creators warn us about edge cases where it may not work.
The example we saw today used static data, but it can be easily used with streaming data from performance monitoring tools or IoT devices. It’s free, easy to use, and can be a great tool for time-based data analysis.
Next Steps
- Learn more about time series data and times series databases like InfluxDB.
- Sign up for Grafana.com account, download plugins for different applications to play around.
- Look at the publicly available Grafana dashboards for databases and think how you can create one for SQL Server.

Sadequl Hussain lives in Sydney, Australia and holds a Bachelor’s degree in Electrical Engineering. His more than 15 years’ experience in IT has seen him in various roles including training, technical writing, web application development and database administration. Sadequl has been working with SQL Server since version 6.5 and his life as a DBA has seen him managing mission critical database systems for various large companies. He is also an Oracle DBA and an avid Linux administrator. Over the years Sadequl has achieved various certifications including those from Microsoft, CompTIA and ITIL. He is currently having fun preparing for other ones from Amazon and the Open Group. He regularly contributes to various SQL Server and Linux online publications. Apart from spending time with his wife and daughter, he loves his part-time career as a photographer and film-maker and also loves to travel.
- MSSQLTips Awards: Trendsetter (25+ tips) – 2017


Useful and interesting talk, can you please share the data after cleansing as I am struggling with entering the data in the table StockQuotes
Thanks