Problem
What things I know now that wish I would have known when I started working with SQL Server Reporting Services (SSRS).
Solution
Wow, what a difference a decade and a half make for SQL Server Reporting Services. The first version of SSRS was introduced as an add on to SQL Server 2000. However, it did not make its actual debut until 2004. I remember seeing the first version, somewhat similar to the below screen shot, and thinking this idea is really neat. It would allow for self-service reporting in real time (as real time as the data was back then). Furthermore, parameters allowed for one report to satisfy a large number of reporting needs and variations. You could actually have dynamic reports!

As my experience with SQL Server Reporting Services grew, so did my taste for trying to squeeze every ounce of functionality out of the product, sometimes spending several hours to "make it work" the way our report consumers desired. That meant dealing with some crazy formatting requests and dealing with many unusual rollups and totaling options. With that said, let’s get to some of the top things I wish I knew about SSRS back then.
SSRS Lesson 1 – Formatting Up Front
Time and time again, I would create a query that gets the needed data in no time, but then comes the hard part, getting all the formatting correct. As shown in the below example, report consumers can request many non-normal formatting options.

These things can include:
- Various background colors and font colors, often changing with each row
- Various align options for both vertical and horizontal alignment
- Merged and split row and column headers
- Specialized formatting for dates, times, and other category row or column labels
- Specialized formatting for hyperlinks and actions
- Turing off / on cangrow and canshrink options for textbox, rows, and columns
- Customized border, lines, and padding
- Up and down writing mode
Thus, it is vitally important to work through all these issues with your end users / report consumers before you start designing the report. This tip can help to get the question going.
SSRS Lesson 2 – Mind Your Page Breaks
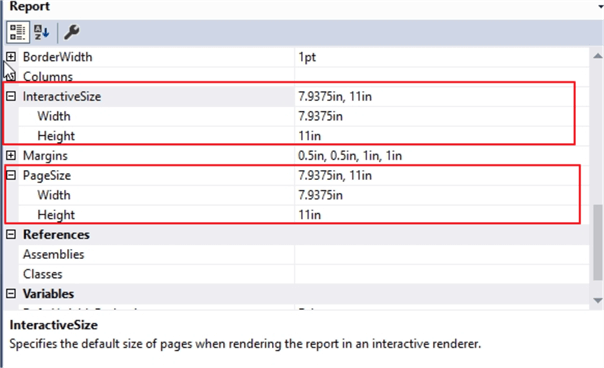
Another item I wish I knew way back when I started with SSRS is to mind your page breaks. You might think I will just let page breaks "initiate" where they fall. However, with SSRS you have multiple layers of page breaks to "mind". The first page break impacts where the breaks fall when viewing online; this particular option is controlled by the interactive page size property. The second property, the page size, controls the page size and as such the page breaks when exporting a report to paginated formats like Word and PDF.
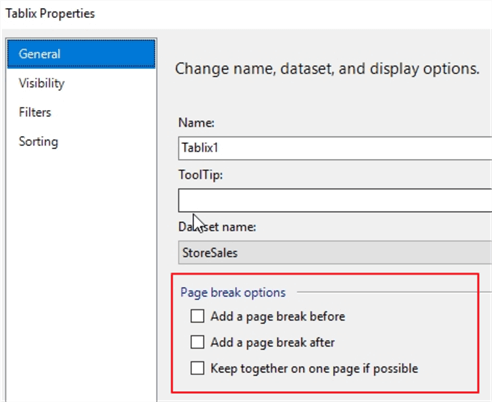
These two properties control the overall page breaks, but additional page break options exist within various report objects, such as charts, matrices, tables, and even rectangles, where you can force a page break either before or after an object. Of course, these properties override the report size page breaks.
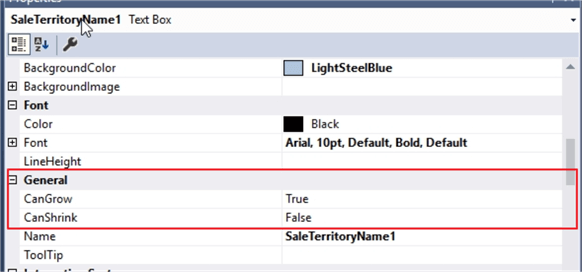
Additionally, as report cells grow and shrink (see prior section), a page break can often be forced to occur as the field, row, or columns grow so large to push the width or length of the object overall to larger than the page size settings. To prevent and restrict this issue from occurring, generally the CanGrow option needs to be set to False.
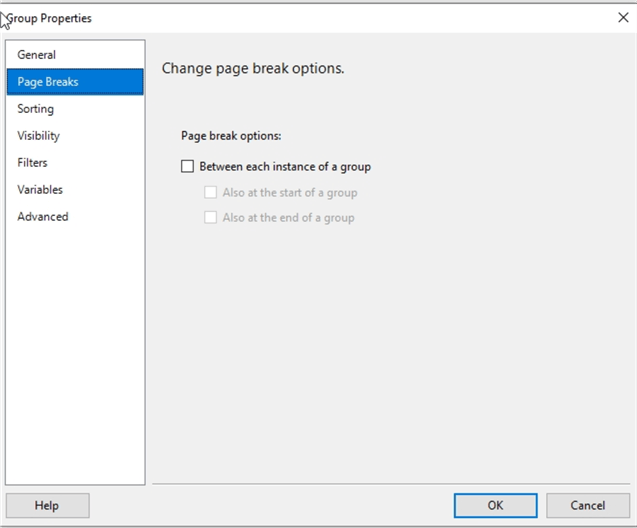
Additionally, within groups, page breaks can be forced between groups which is convenient if you are wanting to produce a separate page for each grouping or bin you have created.
Finally, when attempting to force multiple objects, such as two matrices or a maybe table and a chart, to all be on the same page, often embedding them within a rectangle, as illustrated below, can assist in maintaining the paging for those objects. Using a rectangle forces those objects to stay within the bounds of that rectangle.

Many of these techniques can be further reviewed in this tip.
SSRS Lesson 3 – Know Your Exporting Preferences
This particular area of knowledge centers on being sure to know your report audience and what their desired output options will be. Using these pieces of information, you can cater the end version of your report to that particular audience.
A report being exported to Excel has a very different look and potentially navigation path then being exported to PDF; a PDF report is often printed, while Excel reports are often used for further processing. For example, if you have a report that will always be exported to Excel, you can format the report in such a way that it exports to Excel in an appropriate format for easier reading in Excel. You may want to export to multiple Excel worksheets as described this tip. Another alternate strategy for Excel and other export scenarios is using Document Maps and Bookmarks to add drill down capabilities in Excel and PDF files as desired by your report consumers. Finally, one of the newer features to exporting that I have found helpful in certain instances is exporting a report to Power Point. This tip describes that process in detail.
SSRS Lesson 4 – Make Use of Custom Code and Variables
Of course, as with any tool, there are times that you need to go "outside" the normal toolset to achieve the desired results. For quite some time, I struggled with showing percentages on a report when the percentage was the ratio of two figures and the denominator in that ratio happened to be zero. That situation certainly produces a divide by zero error which is displayed as an Error on a report. Most report users hate to see the word "Error" on a report. On simple and also stylistic way to get around this issue is to use Report Embedded code as described in these two tips (Tip 1 – Report and Error Handling and Tip 2 – .NET Code Report Formatting and Error Handling). In the divide by zero issue, we can easily add the following code to handle these situations.
'*************************************************************************
' Handle divide by zero without an error
' Author: Scott Murray
'*************************************************************************
Public Function CalcDivision(ByVal Numerator As Object, _
ByVal Denominator As object, ByVal DivideByZeroDefault As Object) As Object
  If Denominator <> 0 Then
    Return Numerator/Denominator
  Else
    Return DivideByZeroDefault
  End If
End Function
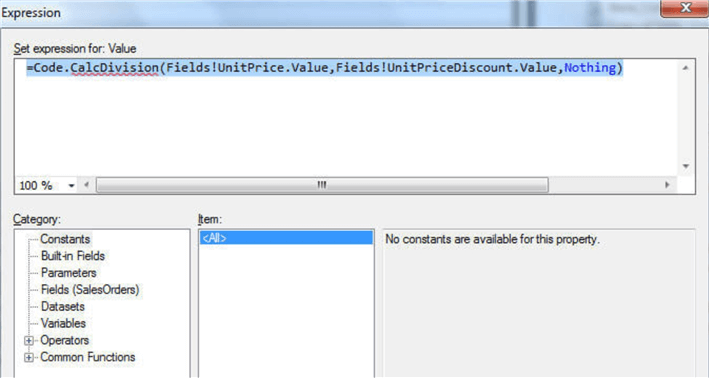
This code is added in the Report properties as shown below:

Then, within a textbox we can call that code using a formula like the one shown below:
One potential caveat to using the report code is that it must be copied from report to report or utilized in some sort of SSRS report template. However, once perfected, the code can be easily copied from report to report and can be used to control many options and properties including items, such as, font and background colors, and custom complex formulas.
SSRS Lesson 5 – Utilize Repeating Row and Column Headers
Inevitably, even with your best efforts described in the page break section, you will often have a set or group of data rows or columns that will get "pushed" to a second page. When this situation occurs, you should be prepared to repeat the row and column headers on each page. Although this process sounds easy, in practice when you have multiple row and column groups, you may experience difficulty getting the repeating headers.
The first setting that must be set for a matrix to repeat headers is the Repeater headers for each Row / Column on each page property as shown below. This setting should satisfy the simplest of repeating headings dilemmas.

Furthermore, this setting controls only the repeating of the header on pages. An additional setting, also shown above, allows for the row or column setting to remain visible when scrolling interactively on a page. These settings address the bulk of repeating row and column headers, but if you have multiple levels of headers, it may not work as desired.
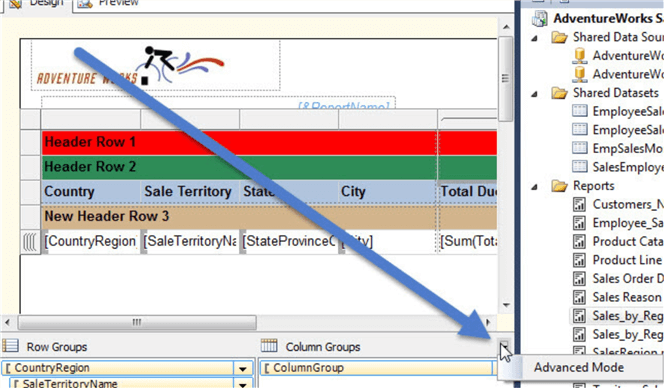
In those complex situations, you will need to go to the Advanced Mode for the group as illustrated next.
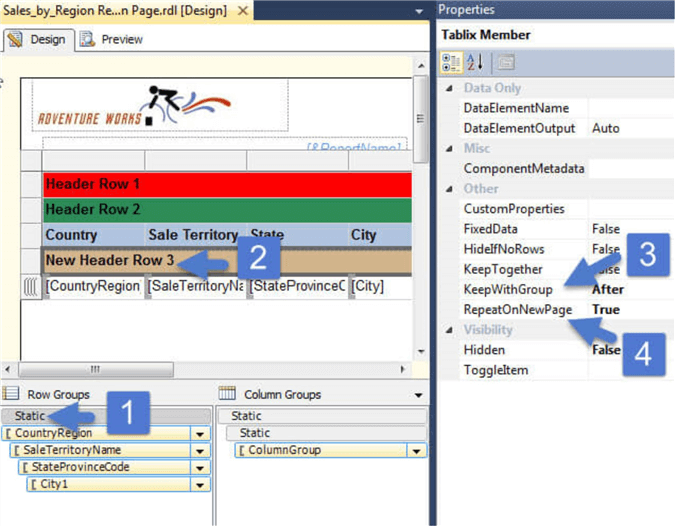
From that point, the static settings of Keep with Group (set to After) and Repeat on New Page (set to True) would need to be adjusted for the row in question, similar to the below example.
These items are covered in this tip on Report Headers.
SSRS Lesson 6 – Hidden and Cascading Parameters can be your friend
Another option that I wished I had made use of when I first started with SSRS is to utilize hidden, internal parameters and cascading parameters. Hidden and internal parameters are parameters that are not presented to the end users when running a report. The basic difference between the two are hidden parameters can be set at runtime and can be set when creating a subscription; internal parameters are not available in either case.

Both parameter types allow for the setting of a value without the user seeing or interacting with the setting of the values. These parameters are helpful when setting default values such as run date time or load date time. They are also handy when doing initial testing of a report to set specific values. Finally, these types of parameters allow the manipulating and adjustment to other values set by a parameter.
In a similar vein, cascading parameters provide a way to limit a parameter’s selections based on the value from previous parameter(s). When I first started creating parameters, I would create a separate non-related query for each parameter; I quickly learned that end user does not like to see values in parameters that actually did not exist. For example, a top-level parameter would be Country and the next level would be state / province. A user would select the country of Canada, and then see all states and provinces including those that are not the 10 provinces of Canada. A better option is to use a cascading set of parameters where selecting Canada in the first parameter would limit the second parameter to only the 10 Canadian Provinces. This particular tips discusses cascading parameters in detail same process, but with MDX.
SSRS Lesson 7 – Shared data sources and data sets can save you lots of time
The last item I wish I had known about when I started using Reporting Services centers around using shared data sources and shared data sets. Creating a shared data source as opposed to one embedded within a report allows for that data source to be reused by multiple reports. As shown below we can establish a shared data source that is used by multiple reports.

Once this shared data source is published to the SSRS web service, it can be shared by many reports which can be adjusted to point to this published data source.

If something changes with the data source, such as a password change or database name, it will only need to be changed once and not inside each report.
Following a similar pattern is a shared dataset; using shared datasets has allowed me to repeat and reuse specific code across multiple reports which maintaining a single query or stored procedure for that dataset. I find that shared datasets are especially helpful when dealing with dimensional or lookup type of values, such as a location, store or territory. The values are often used as the basis for parameters. An example of a shared dataset is shown below, and similarly, once published can be used by multiple reports.

Conclusion
In this tip we covered some of the various SSRS tips that I wish I knew when I started working with SSRS. SSRS is a great tool and can only be made better by using it to its fullest potential. Its fullest potential is achieved by using and including commanding features such as page breaks and formulas; it also includes making use of shared data sets and data sources, repeating headers, and taking advantage of embedded SSRS code.
Next Steps
- Recommended reading:
- All MSSQLTips.com SSRS Development Tips
- SSRS Configuration Tips
- SSRS 2017 Tutorial

I have a passion for crafting Business Intelligence Solutions for my user groups. My experience includes almost 15 years of SQL Server involvement with the last 12 years focused specifically on Business Intelligence, SharePoint, OLAP, SSRS, and Decision Support solutions. Currently, I am a Business Intelligence Architect in the healthcare industry, and I also teach database and analytics classes for Kennesaw State University, Southern New Hampshire University, and Reinhardt University. My education includes an MBA and an undergraduate in Accounting (yes I am a reformed accountant!), both from Kennesaw State University. I enjoy every day by trying to grow my faith and spend precious time with my family. I have been happily married to my wife of over 20 years, and we have two teenagers one who we home school with the help of a University Model School, Cornerstone Prep in Acworth, GA (cornerstoneprep.org). Our other child is a Construction Management major at KSU’s Southern Poly / Marietta campus. We are a soccer and Cross Country (XC) family who play, coach, and referee soccer or run for fun most every day. For several years, our family has volunteered (and played with the dogs and cats) at Etowah Valley Humane Society in Cartersville, GA.
- MSSQLTips Awards: Champion (100+tips) – 2016 | Author of the Year – 2015 | Author Contender – 2014, 2016-2021