By: Siddharth Mehta
Overview
Visualizations that we discussed up until now are independent pieces of information. Dashboards are inevitably interactive reports where different pieces of information are bound by a common scope. Mobile Report Publisher provides three different types of navigators - Time Navigator, Selection List, and Scorecard Grid.
Explanation
In this section we will look at each type of navigator.
Time Navigator
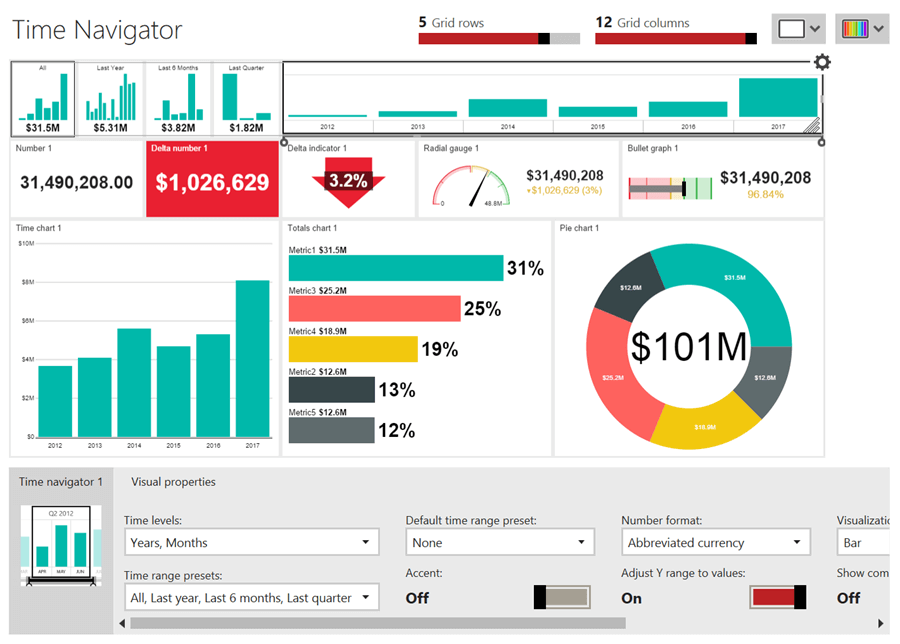
Time navigator is the most common and simplest of all the navigators. Time is an inevitable dimension for data analysis and scoping data over time adds the required navigation element to the dashboard. Options are available to configure time levels, range presets as well as the visualization type like bar, line, area, etc. Time levels allow us to define the drill-down hierarchy, range presets facilitate the selection of different ranges of time, and the visualization type configures the visual to be shown for each time range. Below is a sample dashboard that contains charts, gauges, and a time navigator.
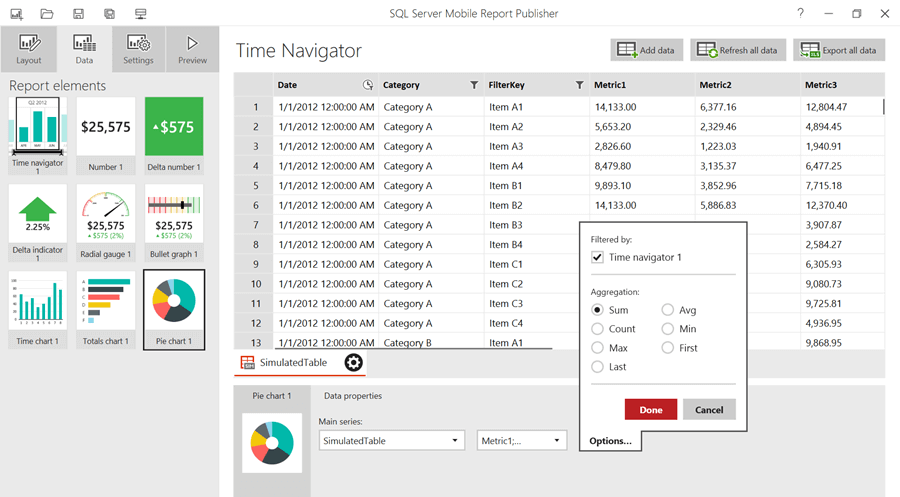
In order to add interactivity to reports, each control on the report needs to be filtered by the navigator as shown below. With this configuration, any selection made on the time navigator will filter the dataset and refresh the associated controls that have accepted to be filtered by the time navigator.
Selection List
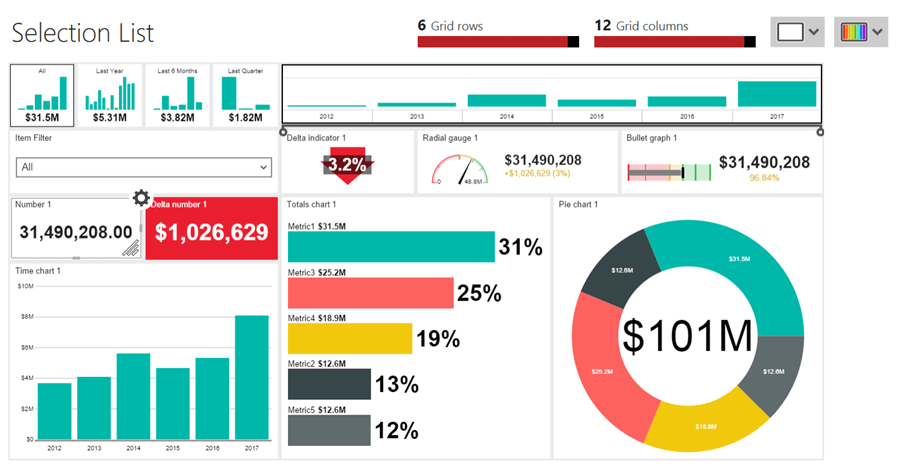
A selection list navigator enables adding parameters to a report in the form of a tree or a dropdown list. When data needs to be filtered by a different dimension than time, selection from a list is an ideal control.
Scorecard Grid
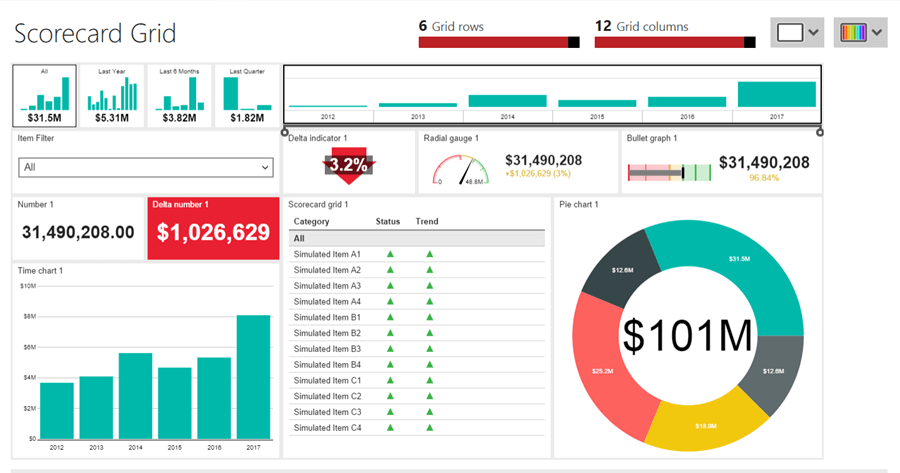
The scorecard grid navigator enables developing scorecards. KPIs contains status, trends, goals, and actual values. Scorecards display a set of KPIs along with associated attributes as shown below. Selection of the selected item in the scorecard grid will result in the filtering of the associated controls and dataset as configured.
Consider downloading all these reports from here and analyze these dashboards and the configuration of navigators.
Additional Information
- Practice developing at least one sample dashboard containing at least one visualization of each category.
