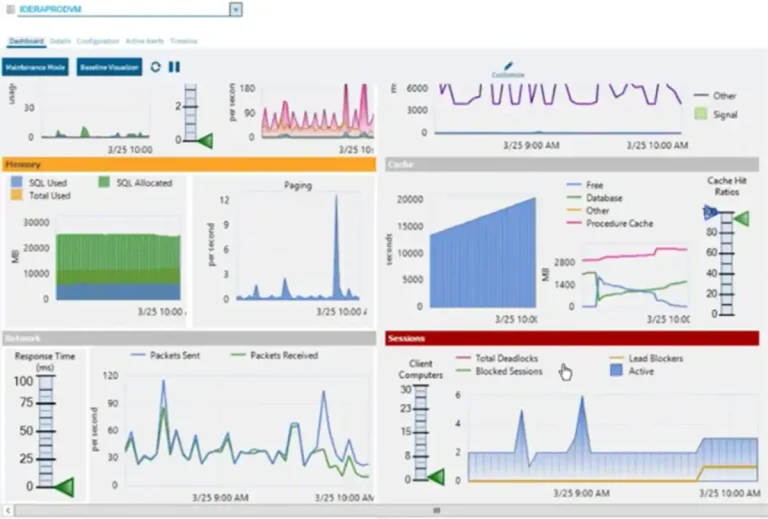
Problem
SQL Server performance tuning or monitoring is not a guessing game. It needs historical data for comparison so that you can identify “normal” or “abnormal” behavior of your workload. This tip will guide you through what historical data to capture, how to capture it, and how to view the recorded data — so the next time someone says, “The database is slow”, you will have data to give solid feedback.
Solution
There are different approaches to create a SQL Server baseline e.g. DMVs, Perfmon counters, free open-source tools, and paid tools. In this article, we will explore windows performance counters to collect different performance related data, automate the data collection procedure and view the captured data for building our SQL Server baseline.
Key Takeaways
- SQL Server performance tuning requires historical data to identify normal and abnormal workload behavior.
- Creating a SQL Server baseline involves setting goals, selecting the right tools, collecting data periodically, and reviewing it.
- A baseline helps understand typical behavior, detect performance degradation, simplify troubleshooting, and plan for capacity.
- Key Perfmon counters include Processor Time, Available Memory, and SQL Server Statistics, among others.
- Regularly update baselines to reflect changes in data volume, user growth, and system updates for accurate performance monitoring.
SQL Server Baseline
SQL Server baseline is a set of statistics and metrics, which manifest the typical behavior of your SQL Server under normal operating conditions. Usually, this long-term data covers a minimum one full business cycle (e.g. for bank one month) metrics. Before establishing the baseline, you should:
- Set your goal – what you want to monitor e.g. overall performance or some specific queries performance.
- Pick the right tool – choose the appropriate tool like DMVs, perfmon, open source or paid tools.
- Periodic data collection – based on your goal and selected tool, set data capture interval and capture data periodically.
- Data review – analyze data and determine the normal, average and peak values of each counters during the regular and busy hour. Align your full team about these values.
Why Create a Baseline
There are several reasons why creating a baseline for your server is useful.
Here are a few key reasons:
- Understanding typical behavior – a baseline tells the normal behavior of your workload at off-peak hours, at peak business hours and during special events like month-end activities.
- Detecting performance degradation – a baseline helps you detect performance degradation by comparing present metrics with past. So, you can identify the present status of your workload.
- Simplifying troubleshooting – when an alert fires or someone reports slowness, you can compare current metrics to your baseline to isolate anomalies quickly.
- Capacity planning – a baseline shows resource consumption trends and helps you forecasting future requirements of CPU, memory, disk etc.
- Measure the impact of changes – you can easily evaluate the impact of any index modification, a new query optimization, or a new hardware’s performance.
- Migration and Consolidation – when migrating to a new environment (e.g., on-prem to cloud), the baseline helps determine the appropriate service tier or VM size to ensure required performance levels are met.
Key Perfmon Counters
Perfmon counters expose a wide range of metrics related to SQL Server, OS, and hardware.
The following list shows some important counters. You can either monitor them all or based on your monitoring goal ignore some of them.
- Processor – % Processor Time, % Privileged Time
- Memory – Available MBytes, Pages/sec
- Physical Disk – % Disk Time, Current Disk Queue Length, Disk Transfers/sec, Disk Bytes/sec
- System – Processor Queue Length, Context Switches/sec
- Network Interface – Bytes Total/sec
- SQLServer:Access Methods – FreeSpace Scans/sec, Full Scans/sec
- SQLServer:Buffer Manager – Buffer cache hit ratio
- SQLServer:Latches – Total Latch Wait Time (ms)
- SQLServer:Locks – Lock Timeouts/sec, Lock Wait Time (ms), Number of Deadlocks/sec
- SQLServer:Memory Manager – Memory Grants Pending, Target Server Memory (KB), Total Server Memory (KB)
- SQLServer:SQL Statistics – Batch Requests/sec, SQL Re-Compilations/sec
- SQLServer:General Statistics – User Connections

Creating the Baseline
Building the baseline is quite easy using perfmon counters. Follow the below steps to add appropriate counters based on your monitoring objective:
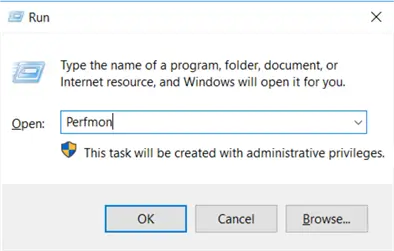
Open the “Run” window and type “Perfmon” and hit the OK button to open the perfmon window.
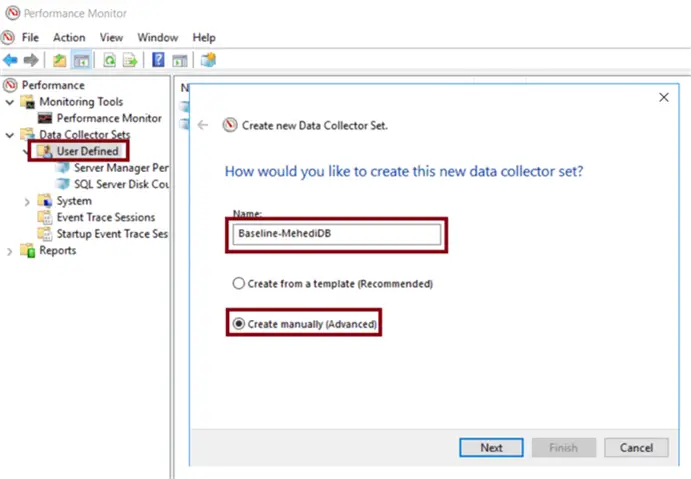
Right Click on “User Defined” and choose New > Data Collector Set. Type a name of the collector set for example “Baseline-MehediDB” and pick “Create manually (Advanced)” option, then click Next as shown below.
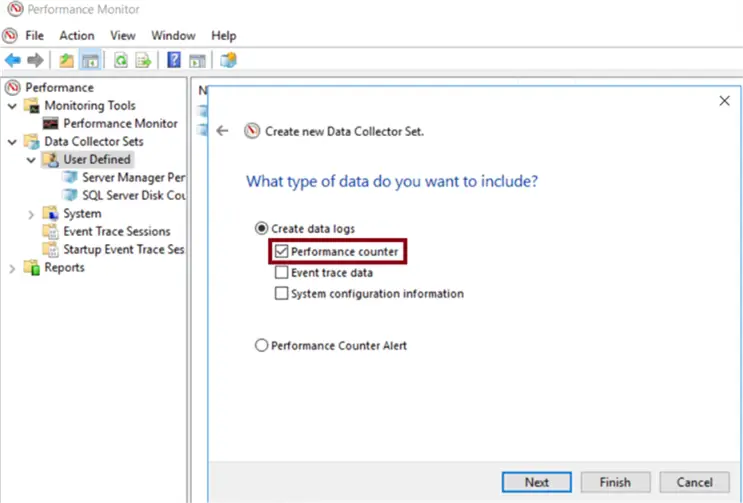
Choose “Performance counter” and click Next as shown below.
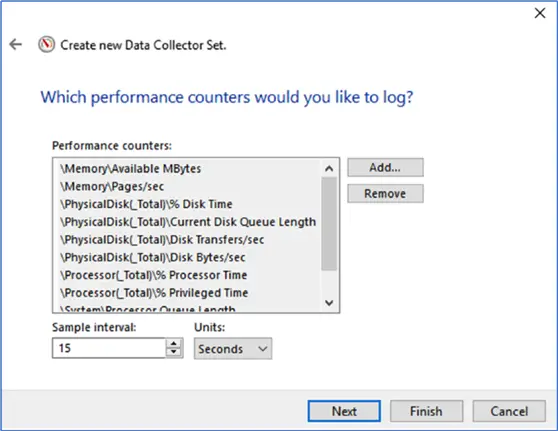
Click on “Add…”, then add the counters from above the key perfmon counters list in the beginning of the article and press OK.

You can change the default sample interval from 15 seconds to your preferred value. Click Next, again Next then press Finish.
Scheduling Data Collection
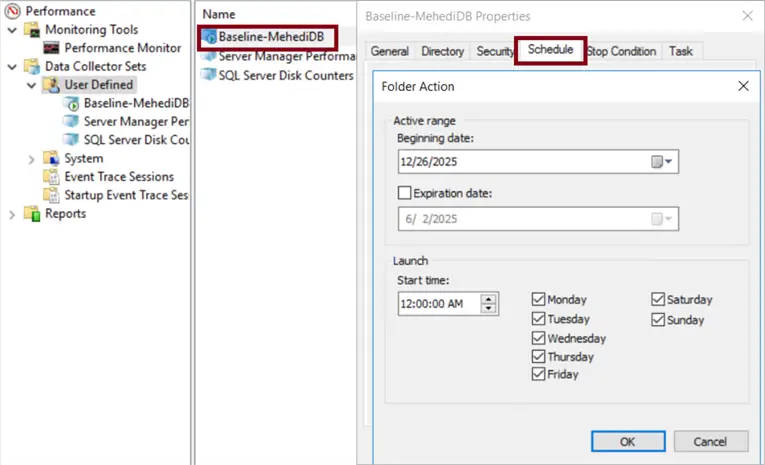
Now right click on your data collection set, in this example “Baseline-MehediDB” then click on Properties and select the Schedule tab as shown below and configure the schedule.
Performance Monitor Reports
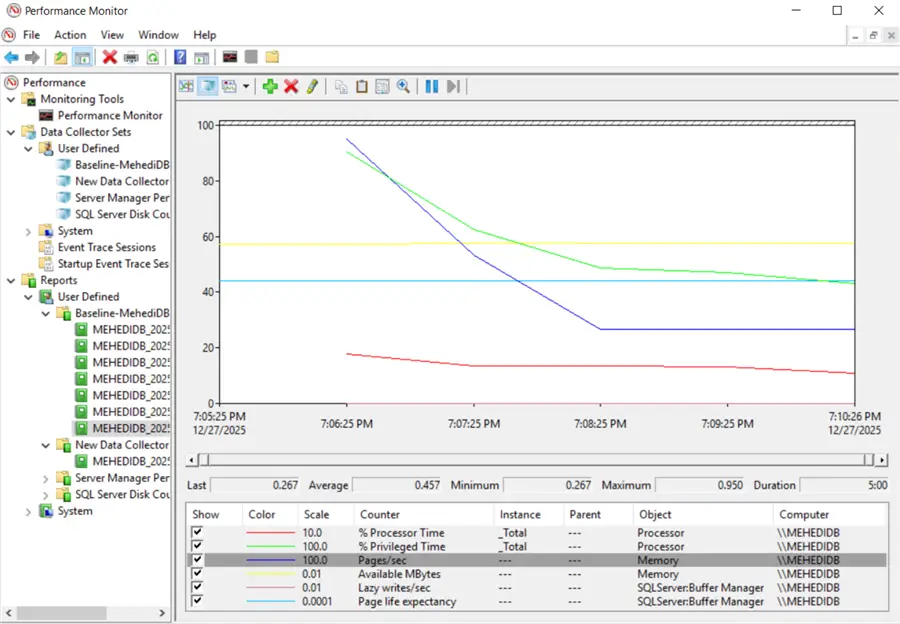
From the Reports section, click on the data set to view the report as shown below.
Caution Using Perfmon Counters
Monitoring too many performance counters too frequently can add overhead to your system. Don’t track too many performance objects. It is important to select only the essential objects based on your monitoring goals.
- Use counter logs instead of real-time Performance Monitor graphs to reduce system overhead. Real-time graphing is more resource intensive. Use it only for short-term monitoring or troubleshooting.
- To minimize overhead, run Performance Monitor remotely from another machine instead of directly on the SQL Server. Connect to the SQL Server by specifying its computer name or IP. Even then, avoid live graph viewing. Try to use counter logs to analyze collected data. It is efficient and has less impact on server performance.
- Copy the counter logs to another machine for analysis. This ensures no extra I/O load on the production system.
- For baseline monitoring, use a longer sampling interval (e.g., 60 seconds) to reduce log file size and disk I/O. Shorter intervals are useful for diagnosing timing issues but generate more granular and heavier data. Choose the interval based on your monitoring goal. Balance, it depending on detail vs. system impact.
Baselines Can Become Out of Date
A database application’s behavior evolves over time due to changes like:
- data volume increase
- user growth
- software updates
- hardware changes
So, old baselines may lose relevance. To stay accurate, update your baselines regularly and archive old ones for identifying long-term trends and patterns.
Next Steps
- Performance Monitor
- Automate Perfmon Stats Collection for SQL Server and Windows
- Performance Monitor Counters for SQL Server
- Establish a Performance Baseline

M A A Mehedi Hasan has been working with EBS Group since 2005. He started his career as a Software Developer and he is now Chief Technology Officer (CTO) of EBS Group. In his long journey, he had the opportunity to work with various technologies like the Microsoft Data Platform, SMS/USSD/IVR based Telecom Value Added Service, and Audio/Video streaming.
As a Microsoft certified Azure Database Administrator Associate, he manages large databases, testing and deployment, performance tuning, long term capacity planning, and streamlining operational workflow. He is also a certified AWS Cloud Practitioner and his team is migrating on-prem services to AWS.
Being a member of techforumbd, a Bangladeshi tech community, he regularly speaks and organizes sessions at local and virtual PASS chapters, SQL Saturdays, and Azure conferences. He also has a course about SQL Server available on the Ghoori Learning and Ostad.app platforms.
In his free time, he loves exploring and learning as much as possible about SQL Server.