By: Greg Robidoux | Comments (1) | Related: > SQL Server Agent
Problem
One big issue with scheduled jobs is that they are often batch type jobs that take a significant amount of resources when they run. Another problem is that these jobs usually run during off hours such as nights or weekends, so there is no one to monitor the jobs resource usage. Without being around to monitor the job activity it is difficult to determine whether the jobs are running efficiently or not. Also, when batch jobs are first implemented they are often done with less data, so the resource needs are not that great, but over time the database grows and often the load for these batch processes grow. So how can you monitor the jobs resource usage while you are not there?
Solution
The easiest and least expensive approach would be to use the built-in tools that Windows and SQL Server offers. These tools are Performance Monitor and Trace. Both of these tools allow you to create a predefined collection of objects to capture and then run these commands from a command prompt. Most people are probably familiar with these tools already and how to use these tools from the GUI, but for both of these tools the collection process can be automated and therefore the data can be collected off hours. In addition, since these processes can be started and stopped when needed there is no need to collect data from the time you leave the office until when you return. Let's take a look at how to automate the data collection process for both Performance Monitor and Trace.
Performance Monitor
For performance monitor you need to first setup a Counter Log. This can be done either by using the command line or by using the Performance Monitor GUI. For this example we will walk through setting up a Counter Log via the GUI.
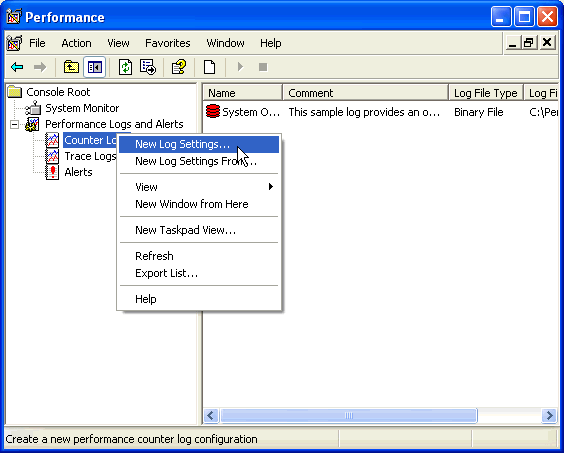
The first thing you need to do is launch Performance Monitor. This application can be found under the Administrator Tools in the Windows Control Panel or you can launch it from the Run prompt by typing in "perfmon" and clicking OK. Under the Performance Log and Alerts select Counter Logs and right click to select New Log Settings. The first thing you need to do is give the Counter Log a name.
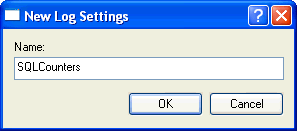
After you supply a name you need to add the counters or objects to be collected. There are several other tips on the internet about what counters to collect, so we won't get into that for this tip.
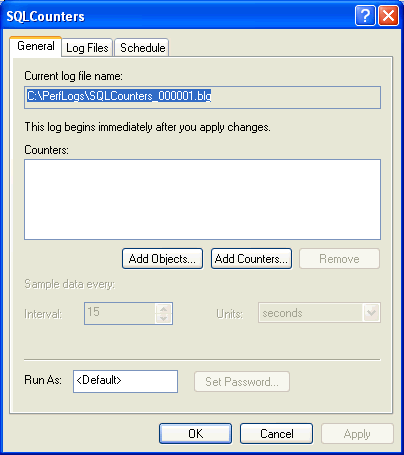
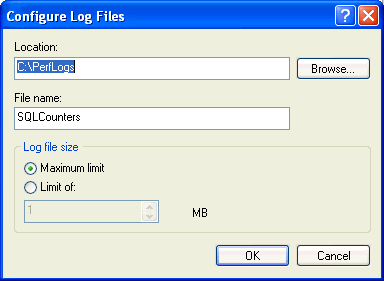
After you select the counters you need to set the log file type. This can be left as it is or you can select Configure to change the options. The configure screen is shown below.
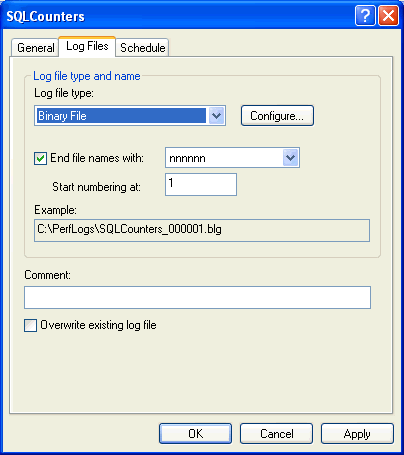
Lastly, you need to set the schedule. Since we will be starting and stopping this from the command line we can set all of the settings to manual. Once you are done click OK and your Counter Log has been saved.
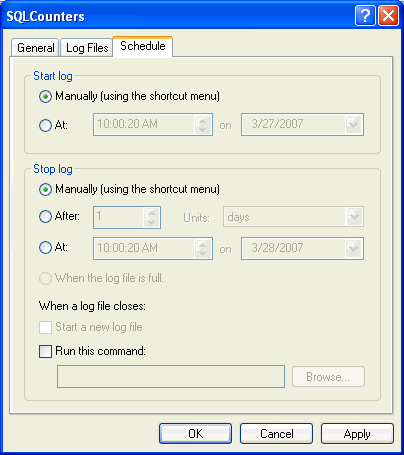
To start and stop this new collection of counters called SQLCounters we can issue the following commands from the Windows command line, from a batch job or from a job step in a SQL Server job.
To Start
logman start sqlcounters
To Stop
logman stop sqlcounters
After you start and stop the data collection, it will create a file such as C:\PerfLogs\SQLCounters_000001.blg. This file can then be opened with the Performance Monitor tool to see the data for the counters that you just collected.
If you run the commands again it will create a new file called C:\PerfLogs\SQLCounters_000002.blg, so the first file is not overwritten.
Trace
For Trace you need to setup a server side trace to collect the SQL Server events you want to capture. A previous tip was written about this, so take a look at this tip: SQL Server Performance Statistics Using a Server Side Trace to learn how to setup a server side trace.
Once the trace definition has been setup, you can use the following commands to start, stop and close and delete a server side trace.
| Task | Command | Notes |
| To find traceid | SELECT * FROM :: fn_trace_getinfo(default) | This will give you a list of all of the traces that are running on the server. |
| To start a trace | sp_trace_setstatus traceid, 1 | TraceId would be the value of the trace |
| To stop a trace | sp_trace_setstatus traceid, 0 | TraceId would be the value of the trace |
| To close and delete a trace | sp_trace_setstatus traceid, 0 sp_trace_setstatus traceid, 2 |
To delete you need to stop the trace first and then you can delete the trace. This will close out the trace file that is written. |
If the trace had a traceID =1 you can issue the following commands.
To Start
EXEC sp_trace_setstatus 1, 1
To Stop
EXEC sp_trace_setstatus 1, 0
EXEC sp_trace_setstatus 1, 2
Putting it all together
So let's stay we have a job called LoadProductionData that runs a stored procedure called spLoadProductionData. To collect the performance and trace data for this job we can setup additional jobs steps to start these processes before the process and then stop them after the process.
Before we get into the job steps, let's assume the following have been created already.
- Stored procedure spLoadProductionData exists
- The performance counter log called "sqlcounters" has been setup
- A stored procedure called "spStartTrace" that has our server side trace settings has been setup. This stored procedure takes one parameter called @filename that is used for the name of the trace files. The default path is "C:\perflogs".
| Job Step | Command | Command Type | Purpose |
| 1 | spStartTrace 'LoadProductionData' | T-SQL | Starts the server side trace with an output file name of c:\perflogs\LoadProductionData.trc |
| 2 | logman update sqlcounters -o c:\perflogs\LoadProductionData | CmdExec | This modifies the output file name for the performance counters to c:\perflogs\LoadProductionData. |
| 3 | logman start sqlcounters | CmdExec | This starts the performance counter collection. |
| 4 | EXEC spLoadProductionData | T-SQL | This is our normal job step to load the data or whatever the job does. |
| 5 | DECLARE @traceID int SELECT @traceID=traceID FROM :: fn_trace_getinfo(default) where value = 'c:\perflogs\' + 'LoadProductionData' EXEC sp_trace_setstatus @traceID, 0 EXEC sp_trace_setstatus @traceID, 2 |
T-SQL | This steps identifies which trace has been setup for the LoadProductionData process. It gets the TraceID and stops and then closes the trace, so you can see the results. |
| 6 | logman stop sqlcounters | CmdExec | This stops the performance counter collection. |
When the job is run and completes there will be at least two files created one for the performance counters and a second for the trace. These files can then be loaded using either Performance Monitor or Profiler so you can see the results of the job.
Next Steps
- If you are not already familiar with these tools take the time to learn more about collecting performance data with Performance Monitor and Trace
- Learn more about server side traces in this tip: SQL Server Performance Statistics Using a Server Side Trace
- Stay tuned for other tips on how to further automate and also correlate data between trace and performance data
About the author
 Greg Robidoux is the President and founder of Edgewood Solutions, a technology services company delivering services and solutions for Microsoft SQL Server. He is also one of the co-founders of MSSQLTips.com. Greg has been working with SQL Server since 1999, has authored numerous database-related articles, and delivered several presentations related to SQL Server. Before SQL Server, he worked on many data platforms such as DB2, Oracle, Sybase, and Informix.
This author pledges the content of this article is based on professional experience and not AI generated.
View all my tips


