By: Ken Simmons | Comments (14) | Related: > Performance Tuning
Problem
I have been getting sporadic deadlocks on my SQL Server. How can I track down the queries that are causing the deadlocks so I can resolve the issue?
Solution
There are a few ways you can track down queries that are causing deadlocks. For example, you can use the Deadlock Graph as shown in the previous tip SQL Server Profiler Graphical Deadlock Chain. Another solution is using a trace flag to write the deadlock information to the error log. In this tip, we will cover a few ways you can implement trace flag 1222 to do just that.
There are two types of trace flags in SQL Server; global trace flags and session trace flags. Some trace flags work at both the global and session level, and some trace flags only work at the global level. Trace flag 1222 happens to be one of the trace flags that must be set globally.
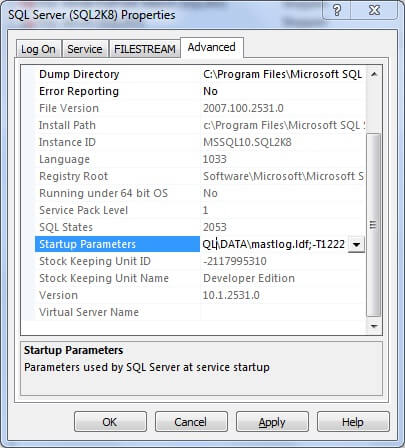
There are two ways to enable global trace flags. You can enable the trace flag when SQL Server starts by using the -T1222 startup option, or you can use the DBCC TRACEON(1222,-1) command after SQL Server has started. The -1 parameter in the DBCC TRACEON command indicates to SQL Server that this trace flag should be set globally. The benefit of using the -T startup option is that you can ensure the trace flag is enabled even if SQL Server gets restarted. You can set the -T startup parameter using the Advanced tab of the SQL Server Properties window as show below.
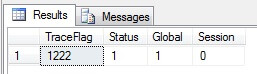
You can check the status of the trace flag using the DBCC TRACESTATUS (1222, -1) command. You can see by the following results that the trace flag is enabled, and that it is enabled globally. You can turn off the trace flag any time by simply issuing the DBCC TRACEOFF (1222,-1) command.
Now that we know the trace flag is enabled, all we have to do is wait for a deadlock to get logged and analyze the output.
You can see the partial output of a sample deadlock below. The first thing to note is the "deadlock victim" which is marked first Then the first block in yellow shows the connection that was the deadlock victim. We can see this is SPID 54. The next set of code that is framed in red is the code that SPID 54 was running. Then the second block in yellow shows the other connection that was in the deadlock, which I have highlighted as SPID 55. The last set of code framed in red is the code that SPID 55 was running that caused this deadlock to occur with SPID 54.
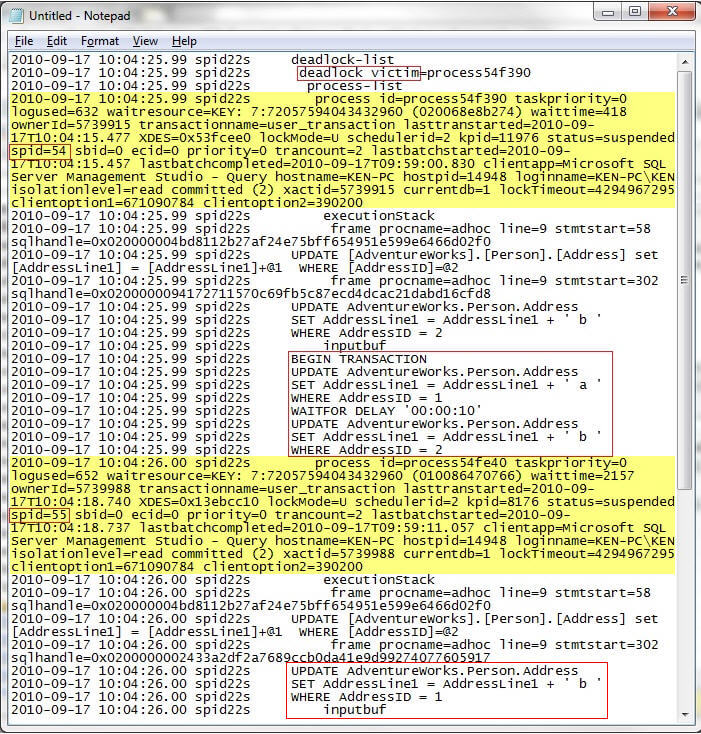
I know this is harder to read than the simple deadlock graph, but it does contain the information we need to analyze the deadlock.
Next Steps
Review the following topics in Books Online for more information on finding and resolving deadlocks.
- Trace Flags
- DBCC TRACEON
- DBCC TRACEOFF
- DBCC TRACESTATUS
- Detecting and Ending Deadlocks
- Review these other tips:


About the author
 Ken Simmons is a database administrator, developer, SQL Server book author and Microsoft SQL Server MVP.
This author pledges the content of this article is based on professional experience and not AI generated.
View all my tips
