Problem
While browsing a cube, if you are using a dimension and fact that are not related, the result can be quite confusing as the results appear as repeating values across all columns and/or rows depending upon the query. The repeating values are sliced or non-sliced aggregated values of the measure. No result or a NULL result would provide a more prompt hint that the dimension and measure group might be unrelated, rather than repeating the same values. In this tip we look at how to deal with this problem.
Solution
To recreate the problem, we need a dimension and measure group on a cube that are not related.
Before we can simulate the problem, deploy the AdventureWorks SSAS sample project that ships with SQL Server, so that we have the AdventureWorks cube. After you have deployed the cube, follow the below steps to simulate the problem.
1) To find out whether a dimension and measure group are related, we can use the “Dimension Usage” tab of the cube designer. Double-click the cube and select “Dimension Usage” tab. You will see a lot of measure groups and dimensions. Use the filters on dimensions to select “Reseller” and “Product” dimension and use filters on Measure Groups to select “Internet Sales” and “Reseller Sales” measure group. After you apply the filters your screen should look as shown below.
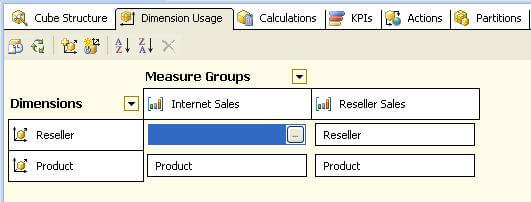
2) We can clearly see that the “Reseller” dimension is not related to “Internet Sales” measure group. Now let’s try to browse these dimension and measure groups. Switch to the “Browser” tab, drag-and-drop “Business Type” attribute from “Reseller” dimension on the rows axis, “Category” attribute from “Product” dimension on columns axis. Now we can see the results where measure groups are related as well as non-related.
3) Clear the details area. Drag-and-drop “Reseller Sales Amount” measure from “Reseller Sales” measure group which is a related measure group to both the dimensions, on the details area. The result should look as shown in the below screenshot.

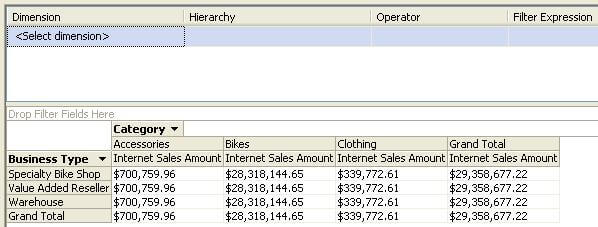
4) Drag-and-drop “Internet Sales Amount” measure from “Internet Sales” measure group which is a non-related measure group to both the dimensions, on the details area. The result should look as shown in the below screenshot. Even if you remove “Business Type” attribute from the rows axis, the values would remain the same and the only change would be that there would be a single row.
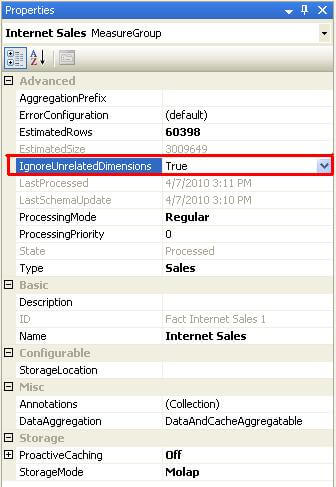
5) Only when you investigate values, or check the pattern of repeating values across various columns, you can predict that there’s something wrong and the probable reason can be that one of the dimension and measure groups are unrelated. If the query would be narrow enough to result in a single cell, one cannot predict whether the result is undesirable due to unrelated dimension and measure groups. If this value is returned as NULL, this would clearly indicate at least some issue with the result. To achieve this result, there is a measure group property named “IgnoreUnrelatedDimensions”. Select the “Internet Sales” measure group, and change the value of this property to “False” from its default value which is “True”. Deploy this change on the server.
6) Repeat step 4 and you should get the result as shown in the below screenshot.
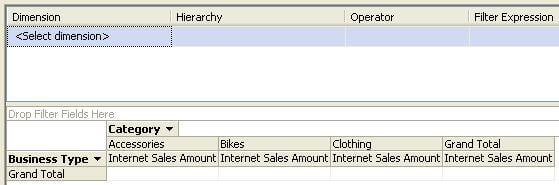
This small property solves our purpose of achieving blank values, instead of incorrect values, which is mostly the aggregated value of the measure.
Next Steps
- Query the cube which involves unrelated dimension and measure group, where the result is a tuple i.e. a single scalar value.
- Test whether you are able to confidently predict if the result is correct, if this value was blank or with an incorrect value.

Siddharth has more than 14 years of experience in the IT Industry, with more than a decade of experience in Business Intelligence and Analytics, for clients banking, logistics, government, Media Entertainment, products, life sciences and other domains. He has been a lead architect for a portfolio of 40+ apps, containing apps in web, mobile, BI, Analytics, data warehousing, reporting, collaboration, CMS, NoSQL and other technologies. He has several certifications and is a published author for online and print-media publications, as well as the MSDN Library.
In his present role, he remains responsible for architecture design, technology stack selection, infrastructure design, 3rd party products evaluation and procurement, and performance engineering. These applications use technologies like Elasticsearch / Lucene, MongoDB, SharePoint 2013 and 2010, jQuery-based framework like Highcharts and GoJS, SQL Server and the Microsoft Business Intelligence stack (SSIS, SSAS, SSRS, MDX, PowerPivot, PowerView), jQueryMobile, Bootstrap, iOS xCode framework, and many others.
- MSSQLTips Awards: Champion (100+ tips) – 2018 | Author of the Year – 2017 | Author Contender – 2016, 2018-2019