By: Ben Snaidero | Comments (11) | Related: 1 | 2 | 3 | > Availability Groups
Problem
The new AlwaysOn Availability Groups feature of SQL Server 2012 provides DBAs with another option for high availability, disaster recovery or offloading reporting. This tip will look at how we can monitor (SQL Server Management Studio, T-SQL, DMVs and System Monitor counters) and make sure AlwaysOn is functioning as expected once properly configured (see Part 1 or Part 2 for how to setup SQL Server AlwaysOn).
Solution
Using SQL Server Management Studio
We'll first start by taking a look at what SSMS provides for monitoring availability groups. In the past I've tended to shy away from using GUI tools to monitor as they usually don't provide as much information as querying backend system tables directly, but so far in testing this new feature you can get quite a bit of information from the dashboard provided within SSMS. Let's first take a quick look at our already configured availability groups.
The feature within SSMS for monitoring Availability groups is the Always On Dashboard. This main dashboard can be accessed by right clicking on the "Availability Groups" folder under the "Always On High Availability" folder in Object Explorer.
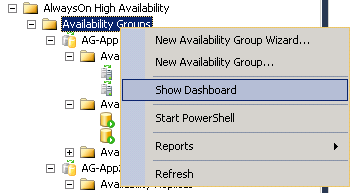
After clicking "Show Dashboard" above you get the following tab. This tab shows you at a high level all the availability groups that are configured on this instance, which instance is the primary instance, their failover mode and an issues column which would contain links to troubleshooting documentation if there are any issues.

From this tab you can drill down to the Availability Group details by clicking on an availability group name. Alternatively you can also access the details dashboard directly from Object Explorer by right clicking on the availability group name under the "Availability Groups" folder.
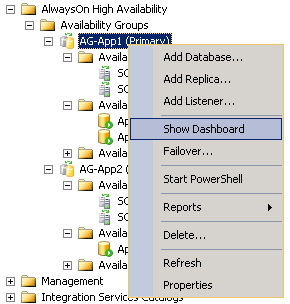
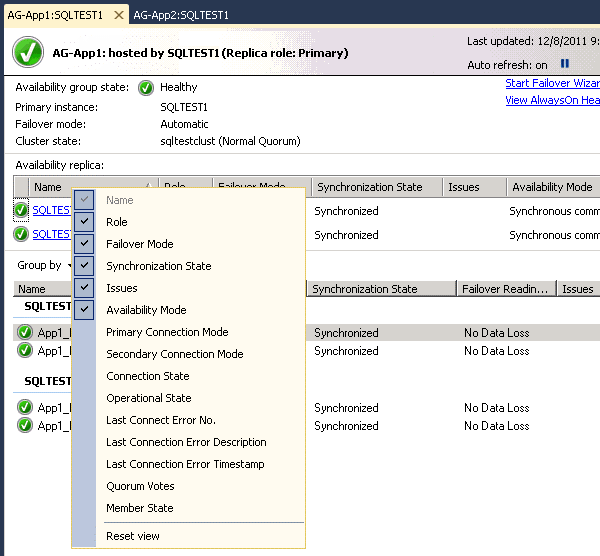
After you do this you are presented with the following tab. This tab contains pretty much all the information you need to monitor what is going on within each of your configured availability groups.
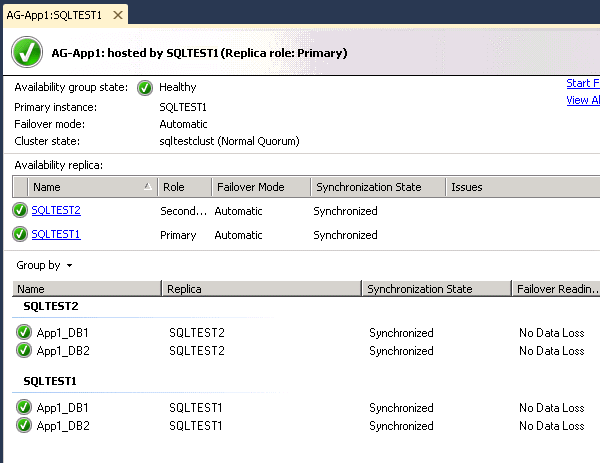
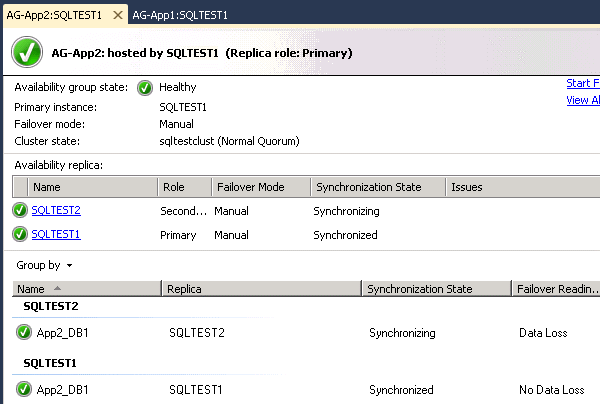
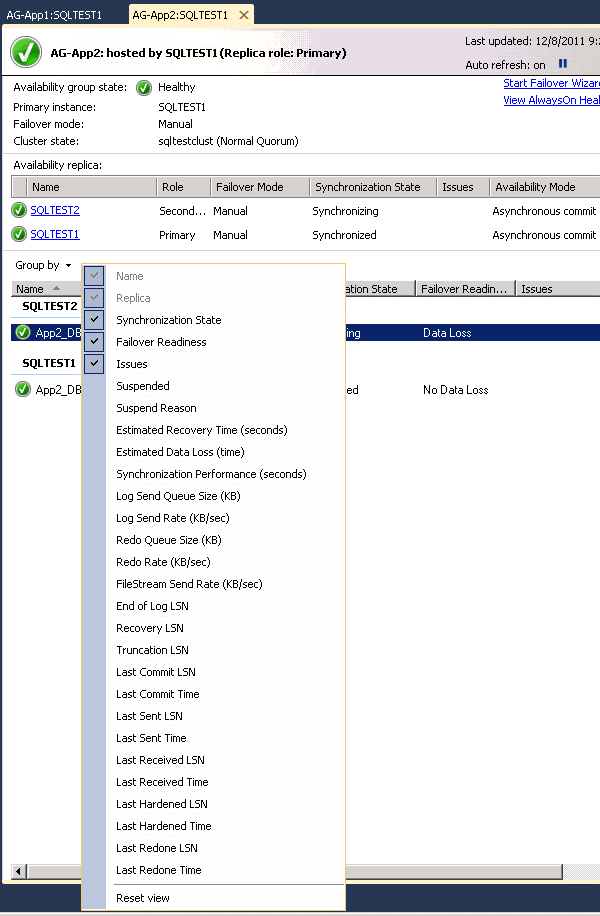
The most important piece of information on this tab is the availability group state. You can see here that for both of our groups this status is "Healthy". Other information in this top section is just a repeat of the information from the summary tab. The Availability replica section of this tab lists all of the instances that are part of this availability group, whether they are the primary or secondary instance and each instances synchronization state. An important thing to mention is that if your availability mode is set to "Asynchronous commit" then the secondary server will never show the synchronization state as synchronized, it will always be synchronizing. This is due to the fact that in this availability mode the secondary database tends to lag behind its corresponding primary database (although there could be points in time where it does catch up to the primary). Under the grouping section, we get a listing of all the databases in each instance that are a part of the availability group. This grouping can be changed and grouped based on the following parameters: Availability replicas, Availability databases, Synchronization state, Failover readiness or Issues. While the screen captures above show the default view, another great feature of this dashboard is that it's configurable. There are many different settings/statistics that can be added to this view which provide even more detail on the current state of your system. For example, if you are running in Asynchronous commit mode you can use the "Last Hardened LSN" value to see how far your secondary databases are lagging behind (if at all). These additional columns can be added by right clicking on either of the column headings as shown below.
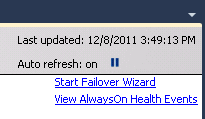
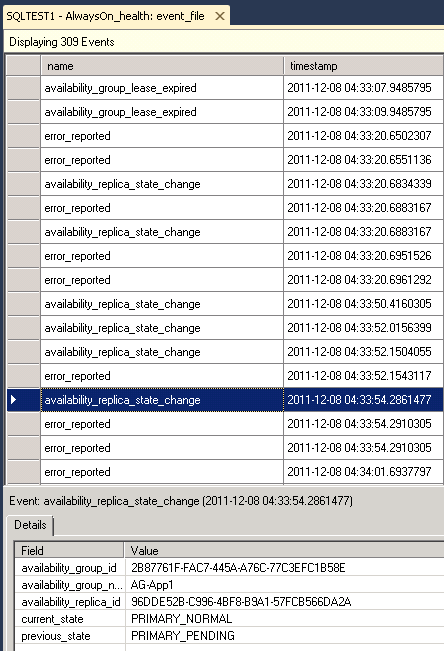
Another good piece of information that is also available on the top right of this tab is the link to list any events captured by the newly created AlwaysOn_health extended event session. By clicking on the link shown in the image below (first image) you get a list of all the events that have been captured on your system (second image).
Using TSQL
Now for those of us that prefer having even more control over how the data is displayed or would like to automate monitoring the health of our system, SQL Server provides us with many new DMVs (link includes description of each parameter) that we can use to create our own customized scripts and output. All of the information displayed in the above dashboards can be queried directly using the following DMVs.
select * from sys.dm_hadr_cluster
select * from sys.dm_hadr_cluster_members
select * from sys.dm_hadr_cluster_networks
select * from sys.availability_groups
select * from sys.availability_groups_cluster
select * from sys.dm_hadr_availability_group_states
select * from sys.availability_replicas
select * from sys.dm_hadr_availability_replica_cluster_nodes
select * from sys.dm_hadr_availability_replica_cluster_states
select * from sys.dm_hadr_availability_replica_states
select * from sys.dm_hadr_auto_page_repair
select * from sys.dm_hadr_database_replica_states
select * from sys.dm_hadr_database_replica_cluster_states
select * from sys.availability_group_listener_ip_addresses
select * from sys.availability_group_listeners
select * from sys.dm_tcp_listener_states
Using System Monitor (Performance Counters)
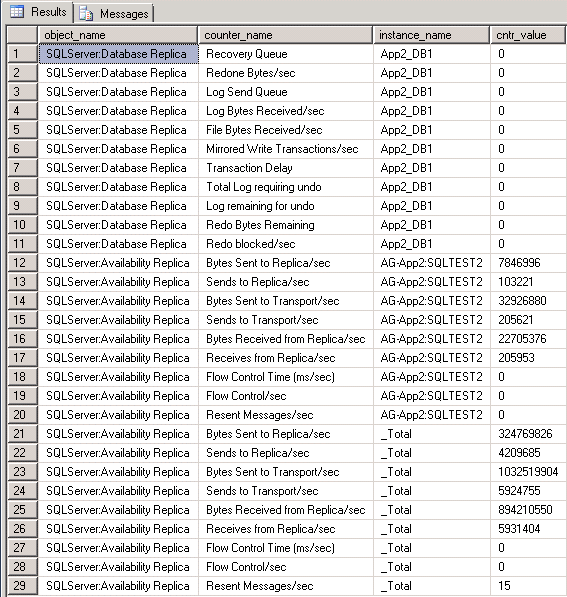
SQL Server has also added additional performance counters to help us monitor what is going on with our availability groups. Within System Monitor there are two new objects, SQLServer:Database Replica and SQLServer:Availability Replica, which contain a number of different counters that can be collected and used for analysis. For those of us that prefer using TSQL, I include myself in that category, these counters are also exposed through the sys.dm_os_performance_counters DMV. Using the following query we can see exactly what counters are available.
select object_name,counter_name,instance_name,cntr_value
from sys.dm_os_performance_counters
 where object_name like '%replica%'
A complete description of each of the below parameters can be found on the links above but the below result set gives you an idea of what's available.
Next Steps
- Create scripts using DMVs that you can schedule to automatically monitor your AlwaysOn availability groups
- Include these checks in your daily monitoring scripts
- Investigate using PowerShell to help monitor/manage AlwaysOn availability groups
About the author
 Ben Snaidero has been a SQL Server and Oracle DBA for over 10 years and focuses on performance tuning.
This author pledges the content of this article is based on professional experience and not AI generated.
View all my tips


