By: Kun Lee | Comments (6) | Related: > Replication
Problem
We have a very complicated replication environment and we have a lot of subscribers as well as distributors to support the environment. Once in a while, we get replication errors like below from our distributor server via replication alerts when we didn't drop a replication component cleanly. Since we have so many subscribers and distributors, it is not that easy to find where it is coming from, especially when there is no agent name. Keep in mind that this gets even harder when you are using "Pull Transactional Replication", since you need to track down the server where the job is being run. For push replication, you can find the orphan job on the distributor, but even this requires detective work.
Here is the error message:
Typically, if you use the below query you get the information that you need most of the time, but once in a while you don't get what is needed.
use distribution
SELECT TOP 5 *
FROM msdb.dbo.sysreplicationalerts
WHERE alert_error_text like 'Replication-Replication Distribution Subsystem: agent (null) failed%'
ORDER BY time desc
Solution
There are many ways to troubleshoot this, like using the Central Management Servers feature and writing a multi-server query to get all failed jobs. We can also try to query the MSpublications table, but often that information doesn't have what is needed. So, I used Profiler to track where the error is coming from and I'd like to share what Events and Filters I used to track it down. I also included the Profiler template file for you to download and import at the end of article.
Setup SQL Profiler
For Events you need to add the below events:
Errors and Warnings
- EventClass: User Error Message
- ErrorLog
- EventLog
Store Procedures
- RPC:Completed
For columns you need to add "HostName"
Here is what the Trace Properties look like.
By the way, I use "Organize Columns" to move "HostName" up in the list as shown below.
Modify "Column Filters..." to add "ApplicationName: Replication Distribution History" under "ApplicationName" like below.
Profiler Output
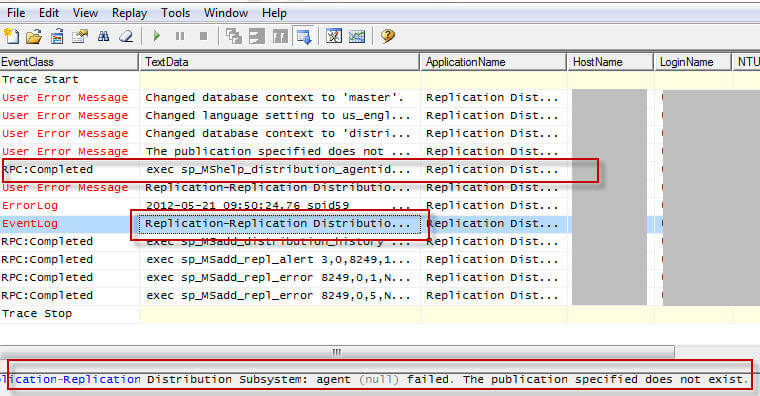
Here is a sample output from the trace events that were set. (Note I masked the HostName to hide this data from my server)

*Note: defending how busy your distributor is, you may get more than what you need, but my recommendation is to set it up this way to get more data and later use the "Find" feature to search for words like "Replication Distribution Subsystem: agent (null) failed".
Steps to Track Down Failing Replication Component
First, you need to pay attention to "HostName" and get the server name where it comes from.
Next, if you click on the "RPC:Completed" line, you will see something like this.
So, based on this command you can collect the below information:
- Publisher DB name
- Subscriber DB name
- Publication name
- Host Name
Then use the above information to connect to the server provided by the host name. You can then find the job on that server and delete the unneeded jobs.
Next Steps
- Download the Profiler template based on the Events that were used in this tip
- You can setup alerts to provide the above information automatically.
- You can write a script to drop and clean up replication in an automated why, so we can eliminate any human errors.
- Stay tuned for this article "Replication - Clean up Orphan Publisher on Distributor Database" for more techniques on how to clean up orphaned replication components.
About the author
 Kun Lee is a database administrator and his areas of interest are database administration, architecture, data modeling and development.
This author pledges the content of this article is based on professional experience and not AI generated.
View all my tips


