By: Brady Upton | Comments (4) | Related: > Microsoft Excel Integration
Problem
Microsoft has introduced a new BI product that will help simplify the data discovery phase for Excel users. "Data Explorer" is an Excel add-in that enhances the self-service Business Intelligence experience in Excel by simplifying data discovery and access. Data Explorer is a preview product so these features may appear differently in the final release.
Solution
In this tip, I'll discuss the prerequisites and how to install and enable Data Explorer and I'll show you how to use this new feature.
Prerequisites:
- Requires Microsoft Office 2010 SP1 or Microsoft Excel 2013 32-bit or 64-bit
- Requires Windows Vista (with .Net 3.5 SP1 or greater), Windows Server 2008 (with .Net 3.5 SP1 or greater), Windows Server 2008 R2, Windows 7 or Windows 8.
Installation:
Download and install the preview from Microsoft Download Center
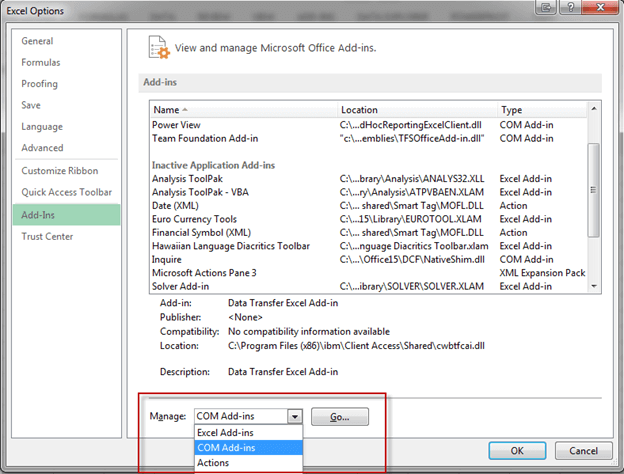
Once the feature is installed open Excel and go to File, Options, Add-Ins. Select COM Add-Ins and click Go.
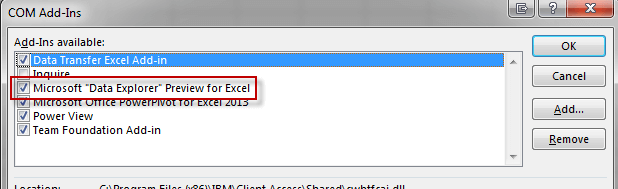
Check Microsoft "Data Explorer" Preview for Excel and click OK.
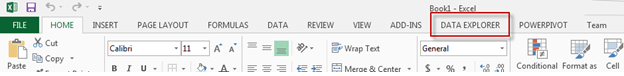
Once Data Explorer has been enabled, the tab will appear above the Office ribbon.
Now that we have Data Explorer installed and enabled we can get to the fun stuff.
To see a detailed list of each element you can visit Microsoft Data Explorer Help
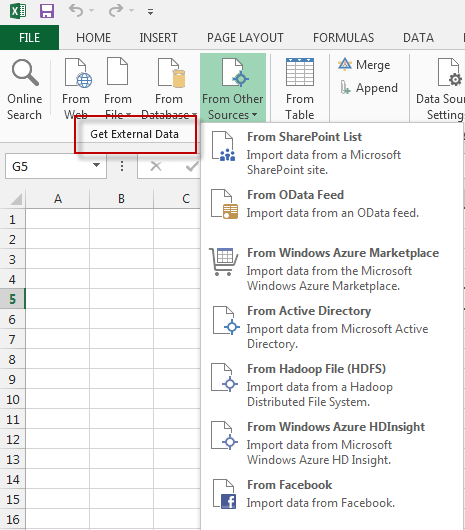
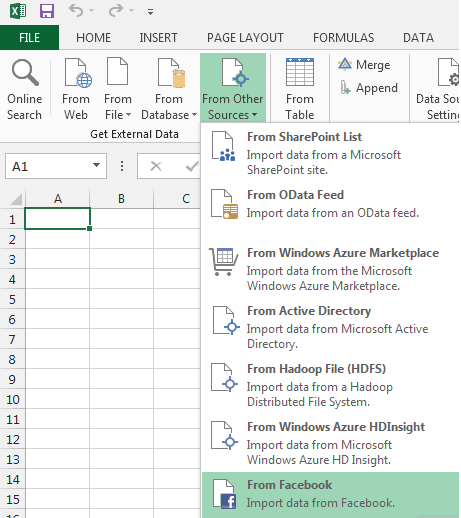
If you click on the Data Explorer tab you will notice Get External Data. Just like Excel and PowerPivot, this is where our data source will come from. There are multiple data sources to choose from including websites, files, databases, Active Directory, and even Facebook. Yes....Facebook.
In this tip, I'll show you examples of two data sources. We'll pull data from a website and create a map report using PowerView and we'll pull data from Facebook and make a report using PowerPivot.
Web Data Source
In the first example, I'll pull table data from the web using Wikipedia. Choose "From Web" from the Get External Data section and use the following URL:http://en.wikipedia.org/wiki/List_of_countries_by_population
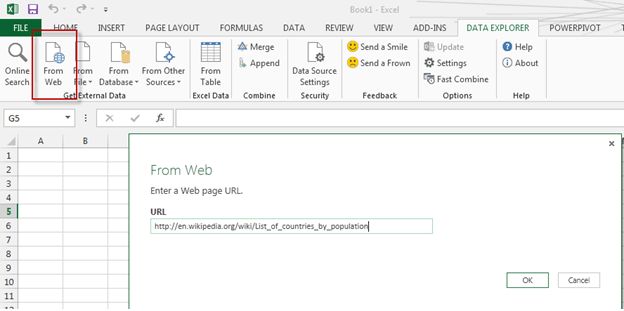
Click OK
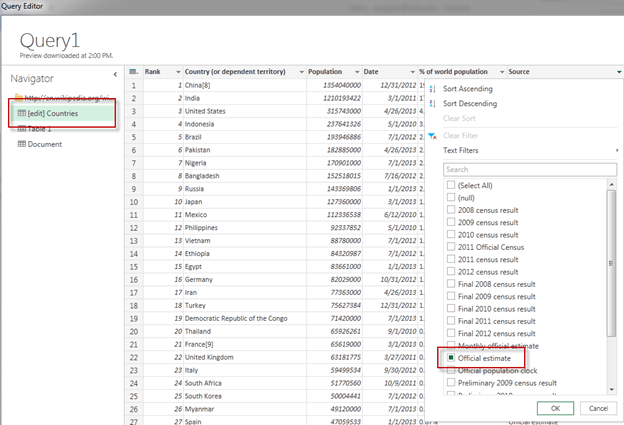
In the Query Editor under Navigator, select Countries. This will display rank, country, population, date, % of world population and source. We can filter columns just like in Excel by selecting the header arrow and choosing the appropriate filter. In this example, we'll filter Source to only includes records that are an official estimate.
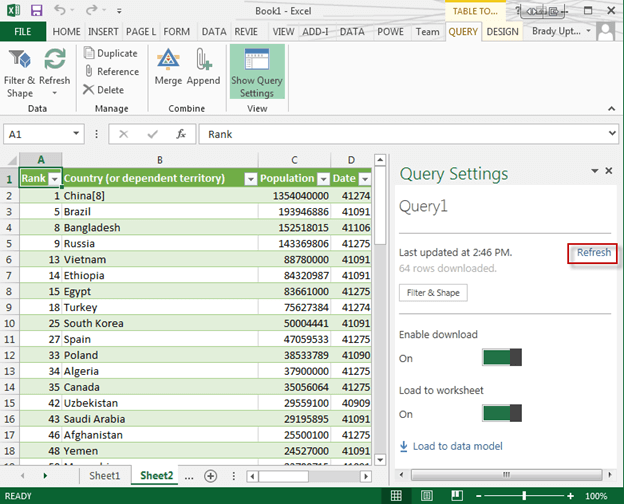
Once you are finished editing the query, click done and the data will be loaded into Excel. Click Refresh under Query Settings to refresh the data.
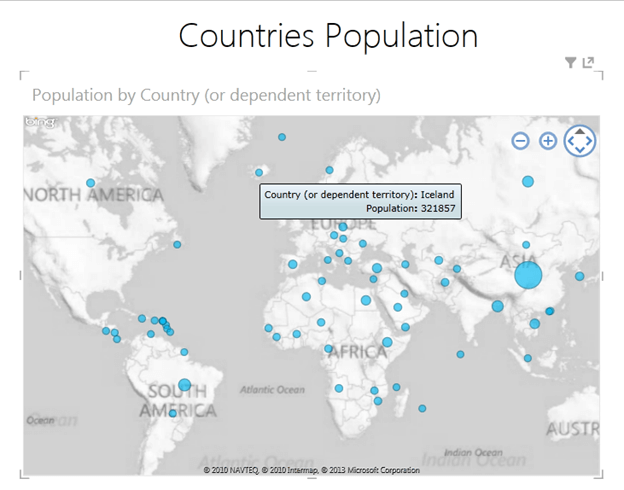
This is a quick and easy way to get data into Excel to use for BI purposes. Below is an example of a report using Data Explorer and PowerView:
Facebook Data Source
In the second example, I'll pull data from Facebook. I'll use my personal account but this is useful for accounts that have a business page associated with them as well.
Choose From Other Sources, From Facebook from the Get External Data section.
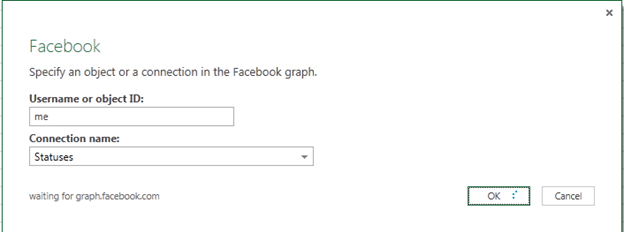
You will be prompted to enter a Username or object ID and Connection name. "Me" is the default which means your personal Facebook account. If you had a business page, for example, MSSQLTips, you could type the business name here. The connection name displays everything Facebook related such as friends, posts, statuses, etc. For this example, I'll choose "me" and Statuses.
This will bring up the Query Editor window where you can see all of the status updates associated with your Facebook account.
I want to see how many likes I have for each message. You will notice under "likes" that the word Table is displayed. This means there is more data that can be imported. If you click Table you can see a preview of the data.
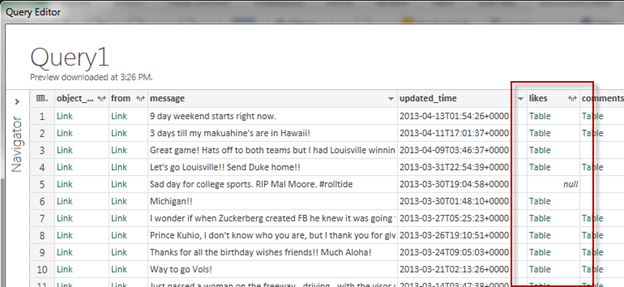
For this example, I can see each person that liked this status.
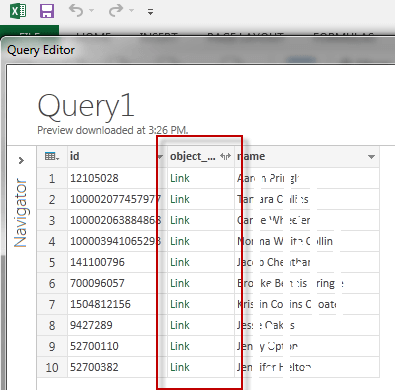
If you click Link, you can see personal information about the particular user.
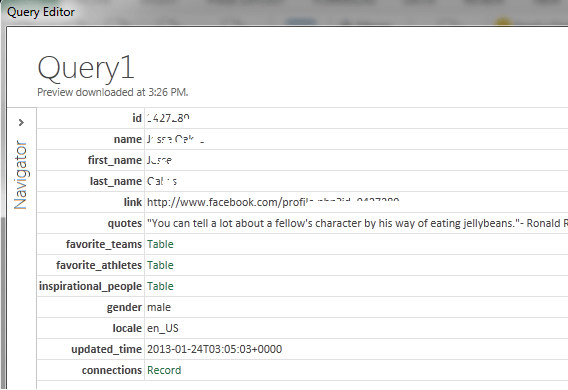
You can also drill further down to see more information. For example, favorite_teams, favorite_athletes, etc.
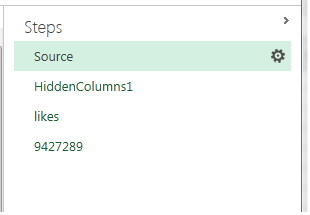
To go back to the main screen, expand Steps (on the right), and click Source.
Once you are finished editing the query, click done and the data will be loaded into Excel. Click Refresh under Query Settings to refresh the data.
The sky is the limit to how many reports you can create with this Facebook data. Below is an example of a report using Data Explorer and PowerPivot:

Next Steps
- To find out more about the Data Explorer preview visit Microsoft here
- View other tips regarding PowerPivot from MSSQLTips.com


About the author
 Brady Upton is a Database Administrator and SharePoint superstar in Nashville, TN.
This author pledges the content of this article is based on professional experience and not AI generated.
View all my tips
