Problem
What date related functions are available in DAX for the Tabular Model version of SQL Server Analysis Service (SSAS)?
Solution
On MSSQLTips, there are many great articles which provide information about the SSAS Tabular Model. I would start with:
- Arshad Ali’s Getting started with Tabular Model in SQL Server 2012 – Part 1-https://www.mssqltips.com/sqlservertip/2821/getting-started-with-tabular-model-in-sql-server-2012–part-1/
- Getting started with the SQL Server 2012 Tabular Model – Part 2 – https://www.mssqltips.com/sqlservertip/2822/getting-started-with-the-sql-server-2012-tabular-model–part-2/
- Ray Barley’s DirectQuery Mode in SQL Server 2012 Analysis Services (SSAS) Tabular – https://www.mssqltips.com/sqlservertip/2934/directquery-mode-in-sql-server-2012-analysis-services-ssas-tabular/
These articles give you a good basis for understanding how the Tabular Model differs from the more traditional MultiDimensional Model. Using the tabular model we are able to utilize in-memory performance and query advantages to provide inputs for Excel Add-in tools such as PowerPivot or PowerView. In either case we can utilize Excel 2010 (OR Excel 2013 if you have a specific volume license) to show you how to utilize some of the common Date and Time Intelligence features of the Tabular Model.
Time Intelligence tools allow for easy comparison of figures such as year over year growth, month over month growth, month-to-date, year-to_date, and parallel period comparisons. You can follow along the examples include in this tip by downloading and installing the ContosoV2SQL SQL 2012 database. Alternately, if you do not have a SQL 2012 instance readily available, you can also download the ContosoV2 zip; this download contains a Contoso Access database and also two Excel starter files which can be used as the source for PowerPivot. We can import the data tables from either the Access DB or the SQL2012 DB directly into PowerPivot within our Excel file. Last, you can start from scratch, and use Tabular Model example. From that point, we will expand our knowledge base by exploring the various ways to use DAX Time Intelligence functions to explore our data.
DAX Time Intelligence
DAX functions are a formula based set of functions very similar to the functions used in Excel; DAX is designed to be used in conjunction with PowerPivot, PowerView or PivotTables. The 30 plus DAX Time Intelligence functions actually can be grouped into a few majors areas:
- Some of the functions return a single date such as the same date one year prior
- Some of the functions return a group of contiguous or non-contiguous dates
- Some of the functions return a period of dates
In many if not all cases, these functions are used in conjunction with or as an input for other DAX Functions, such as a calculation. Additionally as we think about the Time Intelligence functions, their context is tied to the current row unless we specify otherwise in the formula. However, the results can be a single value, a single row in a table, or even a table, set, or range of values. In the below examples we will not cover all the functions, but we attempt to cover examples from each of the various function groups. Furthermore, we will use Excel 2010 and PowerPivot for our examples as most folks are likely still using this version and have not moved to 2013 quite yet. If you do move to Excel 2013, please be sure to review this note about what versions of Excel include PowerPivot.
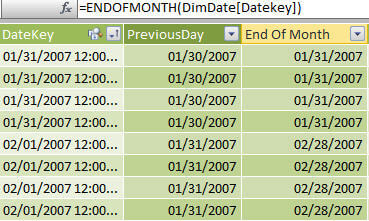
The first set of functions we will review are those that return generally a single value or a single row if a table is returned. Some examples of these functions include ENDOFMONTH, which returns the last date in the month for the current context of the date, and PREVIOUSDAY which returns the day just prior to the input date. The syntax for ENDOFMONTH is: ENDOFMONTH(<dates>) while the syntax for PREVIOUSDAY is: PREVIOUSDAY(<dates>). Using these two functions, the formula and results are fairly simple and the results expected; based on the DateKey column, the PREVIOUSDAY function returns on day prior to the DateKey. The ENDOFMONTH function returns the last day of the month for the related DateKey on the same row. Notice how in the formula we are actually using the DimDate table as the basis; we are using this field as the DimDate table has all sorts of variations of date values such as Month, Quarter, Year, etc which are helpful in PivotTable slices. However, by using the DimDate table, the context of the data we include on our pivot tables needs to also be within the DimDate table context. Following the next example, we will show where the formula context produces incorrect results.

Certainly, theses values are informative and could be used in your pivot. However let us put them to even better use, by creating a new “calculated measure” that provides us with the prior days Sales Amount. In order to create this measure we have two methods we can follow to achieve the same results. We can either create the measure on the calculation area of the PowerPivot Window or we can do it within the pivot table itself. In order to create this measure, we have to employ two additional DAX functions, CALCULATE AND SUM. The SUM function does exactly that, it sums the values in the specified measure while the CALCULATE functions filters the values used in the SUM function.
The actual formula with all three functions is:
=CALCULATE(SUM(FactSales_Limited[SalesAmount]),PREVIOUSDAY(DimDate[Datekey]))
The first method for adding a measure is using the Calculation area of the PowerPivot window. To open up the PowerPivot window, select PowerPivot from the ribbon tabs, and then select Power Pivot Window.

Once you click PowerPivot Window, a new screen will open with your imported data sets (the data from the Contoso database if used). In order to create calculations, you actually need to open up the calculation area which appears below the data sets. If the calculation area is not visible, then it can be toggled on using the Calculation Area button as noted in the below illustration.
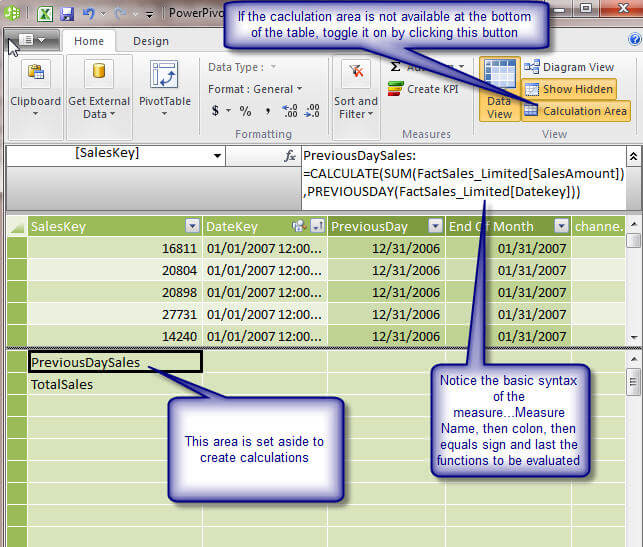
The Calculation area appears below the gray line in the above illustration. Each cell can contain a separate calculation; the calculations do NOT need to relate to the data in the same relative columns above the gray line. The actual formula can be entered in a cell itself or in the function box (f of X box) once the cell is selected.
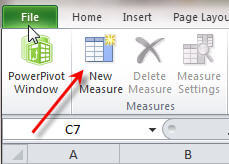
The second method to create a new measure uses the New Measure button on the PowerPivot ribbon within the main Excel window. In order to use this method, again select PowerPivot from the ribbon tab menu, and then click on the New Measure button, as noted below.
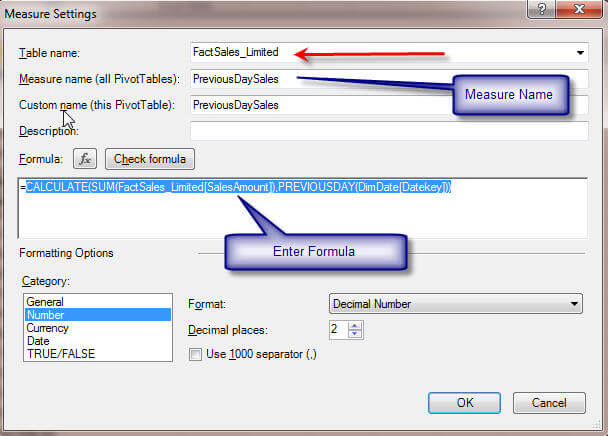
On the Measure Settings screen, select the table where the measure will reside. Next fill in the Measure Name and Custom Name (if desired); next add the formula noted above, and finally in the category box, select the category type. For this example, the measure category is number which allows us to define the format for the measure.
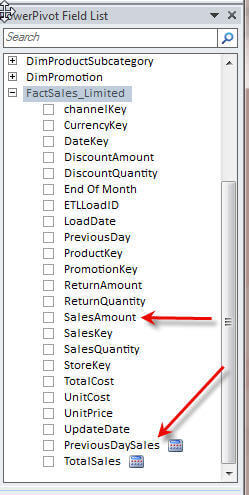
Finally we can create and populate our pivot table to show the fruits of our work in creating this new measure. For this example add the Datekey field from the DimDate table to the Row Labels area of the Pivot table. Next add the Sales Amount and PreviousDaySales field from the FactSales table to the values area.

Below, the resulting pivot table shows the current day sales amount and then the previous day sales amount as illustrated below.

A few items need to be mentioned about our new measure specifically related to the context or scope level used in the pivot. First take a look at what happens in the below example when we use the DateKey field from the Fact Table instead of the DimDate table which was specified in the measure formula. When we switched to the FactSales DateKey, our Previous Day Sales figure disappears, because the measure is evaluated at a different context or scope than the DateKey field used.

In a similar fashion, even if we use the DimDate table, but switch our row label to Calendar Year, the Previous Day Sales value do not bear out. Again the context of the Previous Day Sales is at the DateKey Level, but in the below example we are attempting to view the date in context of the calendar year. You can explore more details and hints about DAX context at: http://technet.microsoft.com/en-us/library/gg413423.aspx.

Time Intelligence Functions that Return a set of Values
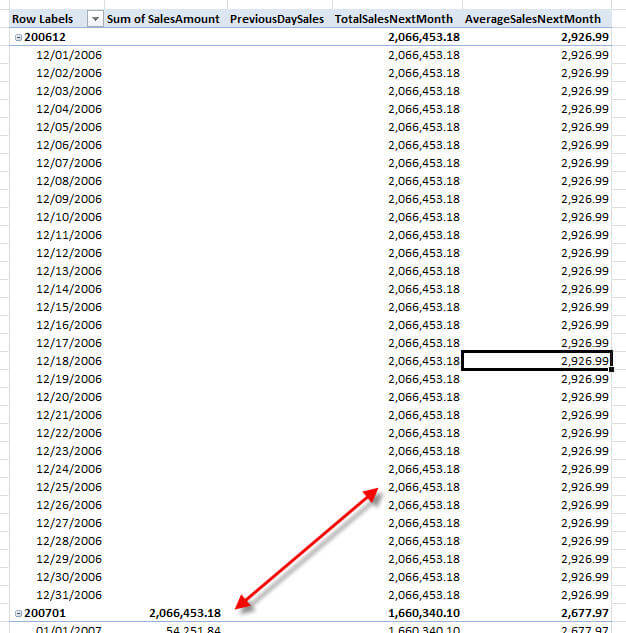
Several of the functions in the Time Intelligence Category actually return a table or array of values. When these functions do return a set of values, they cannot be added as a column on the PowerPivot table as an error will result. Instead, we can again use these functions as inputs into another DAX function. Using the NEXTMONTH function, the below formulas, when added as new measures, will return the Total Sales and Average Sales for the “next” month. Using this logic the value will be the same across all dates for the month.
=CALCULATE(SUM(FactSales_Limited[SalesAmount]),NEXTMONTH(DimDate[Datekey]))
or
=CALCULATE(AVERAGE(FactSales_Limited[SalesAmount]),NEXTMONTH(DimDate[Datekey]))
These formulas result in the following pivot table; notice how the roll up of the sales values by month matches the value returned for the Totals Sales Next Month measure. For the average calculation, note that this value is the average of the individual Sales Amount lines in the table and not the total sales for the day.
Similarly, instead of moving one day or one month, we could use the DATEADD function to move x number of days forward or backward, and get the daily sales value for that day. Our next formula finds the sales amount 10 days into the future.
=CALCULATE(SUM(FactSales_Limited[SalesAmount]),DATEADD(DimDate[Datekey],10,DAY))
Using the DATEADD function in a measure returns the following pivot table.

This type of formula generally works well in period over period type of calculations, such as day over day growth or year over year variance analysis. Some of the other functions that also perform well in these situations include: PARALLELPERIOD, NEXTYEAR, NEXTQUARTER, PREVIOUSYEAR, PREVIOUS QUARTER, PREVIOUSDAY, DATESMTD, DATESYTD, DATESBETWEEN, and DATESINPERIOD.
“No Calculate Needed”
Some of the Time Intelligence functions actually return a measure value and are not required to act as an input for other functions such as CALCULATE. These functions are actually what I like to call short cut functions as they make the formulas much simpler than the longer CALCULATE method. These functions include: TOTALMTD, TOTALQTD, and TOTALYTD.
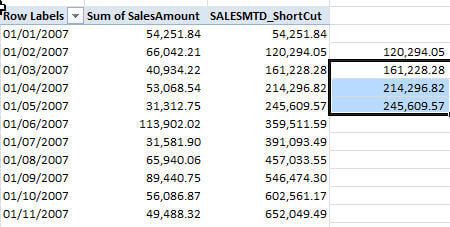
The below example uses the TOTALMTD to source a running total of SalesAmounts.
=TOTALMTD(SUM(FactSales_Limited[SalesAmount]),DimDate[Datekey])
The TOTALMTD function allows for the quick review of the total month to date sale amounts.
Some additional functions that fall under the “short cut” category include: OPENINGBALANCEMONTH, OPENINGBALANCEYEAR, CLOSINGBALANCEMONT, and CLOSINGBALANCEQUARTER. These functions serve very specific purposes related most often to financial statements and inventory type calculations
Conclusion
DAX includes a large range of Time Intelligence related functions; these functions allow PowerPivot designers to quickly navigate a range of dates. Some of the functions work well as arguments for other DAX functions while another set allows for direct calculations against a measure value. Furthermore, some of the functions return a single value and can be added as a column within the PowerPivot table. To the contrary, another group of the functions return a set or table of values which can generally only be used as inputs into other DAX functions. In either case, special care must be taken to note the context of the functions and formulas as not adhering to the a specific scope or context could produce irregular results or no results at all.
Next Steps
- DAX Time Intelligence Functions – http://technet.microsoft.com/en-us/library/ee634763.aspx

I have a passion for crafting Business Intelligence Solutions for my user groups. My experience includes almost 15 years of SQL Server involvement with the last 12 years focused specifically on Business Intelligence, SharePoint, OLAP, SSRS, and Decision Support solutions. Currently, I am a Business Intelligence Architect in the healthcare industry, and I also teach database and analytics classes for Kennesaw State University, Southern New Hampshire University, and Reinhardt University. My education includes an MBA and an undergraduate in Accounting (yes I am a reformed accountant!), both from Kennesaw State University. I enjoy every day by trying to grow my faith and spend precious time with my family. I have been happily married to my wife of over 20 years, and we have two teenagers one who we home school with the help of a University Model School, Cornerstone Prep in Acworth, GA (cornerstoneprep.org). Our other child is a Construction Management major at KSU’s Southern Poly / Marietta campus. We are a soccer and Cross Country (XC) family who play, coach, and referee soccer or run for fun most every day. For several years, our family has volunteered (and played with the dogs and cats) at Etowah Valley Humane Society in Cartersville, GA.
- MSSQLTips Awards: Champion (100+tips) – 2016 | Author of the Year – 2015 | Author Contender – 2014, 2016-2021