Problem
You are looking to retrieve a random sample from a SQL Server query result set. Perhaps you are looking for a representative sample of data from a large customer database; maybe you are looking for some averages, or an idea of the type of data you’re holding. SELECT TOP N is not always ideal, since data outliers often appear at the start and end of data sets, especially when ordered alphabetically or by some scalar value. Likewise you may have used TABLESAMPLE, but it has limitations especially with small or skewed data sets. Perhaps your boss has asked you for a random selection of 100 customer names and locations; or you are participating in an audit and need to retrieve a random sample of data for analysis. How would you accomplish this task? Check out this tip to learn more.
Solution
This tip will show you how to use TABLESAMPLE in T-SQL to retrieve pseudo-random data samples, and talk through the internals of TABLESAMPLE and where it isn’t appropriate. It will also show you an alternative method – a mathematical method using NEWID() coupled with CHECKSUM and a bitwise operator, noted by Microsoft in the TABLESAMPLE TechNet article. We’ll talk a little about statistical sampling in general (the differences between random, systematic and stratified) with examples, and we’ll take a look at how SQL statistics are sampled as a case in point, and the options we can use to override this sampling. After reading this tip, you should have an appreciation of the benefits of sampling over using methods like TOP N and know how to apply at least one method to achieve this in SQL Server.
Setup
For this tip, I will be using a data set containing an identity INT column (to establish the degree of randomness when selecting rows) and other columns filled with pseudo-random data of different data types, to (vaguely) simulate real data in a table. You can use the T-SQL code below to set this up. It should take only a couple of minutes to run and is tested on SQL Server 2012 Developer Edition.
I will also be using the AdventureWorks 2012 (non-DW) database.
SET NOCOUNT ON
GO
CREATE TABLE dbo.RandomData (
    RowId INT IDENTITY(1,1) NOT NULL,
    SomeInt INT,
    SomeBit BIT,
    SomeVarchar VARCHAR(10),
    SomeDateTime DATETIME,
    SomeNumeric NUMERIC(16,2) )
GO
DECLARE @count INT
SET @count = 1
WHILE @count <= 100000
BEGIN
INSERT INTO dbo.RandomData
    SELECT    @count,
            CASE WHEN DATEPART(MILLISECOND, GETDATE()) >= 500 THEN 0 ELSE 1 END [SomeBit],
            CHAR((ABS(CHECKSUM(NEWID())) % 26) + 97) + CHAR((ABS(CHECKSUM(NEWID())) % 26) + 97) +
            CHAR((ABS(CHECKSUM(NEWID())) % 26) + 97) + CHAR((ABS(CHECKSUM(NEWID())) % 26) + 97) +
            CHAR((ABS(CHECKSUM(NEWID())) % 26) + 97) + CHAR((ABS(CHECKSUM(NEWID())) % 26) + 97) +
            CHAR((ABS(CHECKSUM(NEWID())) % 26) + 97) + CHAR((ABS(CHECKSUM(NEWID())) % 26) + 97) +
            CHAR((ABS(CHECKSUM(NEWID())) % 26) + 97) + CHAR((ABS(CHECKSUM(NEWID())) % 26) + 97) [SomeVarchar],
            DATEADD(MILLISECOND, (ABS(CHECKSUM(NEWID())) % 6000) * -1,
                DATEADD(MINUTE, (ABS(CHECKSUM(NEWID())) % 1000000) * -1, GETDATE())) [SomeDateTime],
            (ABS(CHECKSUM(NEWID())) % 100001) + ((ABS(CHECKSUM(NEWID())) % 100001) * 0.00001) [SomeNumeric]
    SET @count += 1
END
Selecting the top 10 rows of data yields this result (just to give you an idea of the shape of the data). As an aside, this is a general piece of code I created to generate random-ish data whenever I needed it – feel free to take it and augment/pillage it to your heart’s content!

How Not To Sample Data in SQL Server
Now we have our data samples, let’s think about the worst ways of getting a sample. In the AdventureWorks database, there exists a table called Person.Address. Let’s sample by taking the top 10 results, in no particular order:
SELECT TOP 10 * FROM Person.Address

Going from this sample alone, we can see that all the people returned live in Bothell, and share zip code 98011. This is because the results were specified to be returned in no particular order, but were in fact returned in order of the AddressID column. Note this is NOT guaranteed behavior for heap data in particular – see this quote from BOL:
“Usually data is initially stored in the order in which is the rows are inserted into the table, but the Database Engine can move data around in the heap to store the rows efficiently; so the data order cannot be predicted. To guarantee the order of rows returned from a heap, you must use the ORDER BY clause.”
Taking this result set, a person uninformed about the nature of the table might conclude all their customers live in Bothell.
Types of Data Sampling in SQL Server
The above is clearly false, so we need a better way of sampling. How about taking a sample at regular intervals throughout the table?
DECLARE @Step INT
DECLARE @Rows INT
DECLARE @Count INT
DECLARE @IntervalTable TABLE (
    IntervalId INT )
SET @Rows = ( SELECT COUNT(*) FROM Person.Address )
SET @Step = ROUND(@Rows / 100, 0)
SET @Count = 0
WHILE @Count <= @Rows
BEGIN
    INSERT INTO @IntervalTable
        SELECT    AddressID
        FROM    Person.Address
        WHERE    AddressID = @Count
    SET @Count = @Count + @Step
END
SELECT        a.AddressId, a.City
FROM        Person.Address a
INNER JOIN    @IntervalTable i ON a.AddressID = i.IntervalId
This should return 47 rows:

So far, so good. We’ve taken a row at regular intervals throughout our data set and returned a statistical cross-section – or have we? Not necessarily. Don’t forget, the order isn’t guaranteed. We might make one or two conclusions about this data. Let’s aggregate it to illustrate. Re-run the code snippet above, but change the final SELECT block as such:
SELECT        a.City, COUNT(*) [Occurrences]
FROM        Person.Address a
INNER JOIN    @IntervalTable i ON a.AddressID = i.IntervalId
GROUP BY    a.City
HAVING        COUNT(*) > 1

You can see in my example that from a total count of more than 19,000 rows in the Person.Address table, I have sampled around 1/4% of rows and therefore I can conclude that (in my example), Concord, Kirkby, Lynnwood and Paris have the most number of residents and furthermore are equally populated. Accurate? Nonsense, of course:
SELECT        a.City, COUNT(*) [Occurrences]
FROM        Person.Address a
--INNER JOIN    @IntervalTable i ON a.AddressID = i.IntervalId
GROUP BY    a.City
HAVING        COUNT(*) > 1

As you can see, none of my four were actually in the top four places to live, as judged by this table. Not only was the sample data too small, but I aggregated this tiny sample and tried to reach a conclusion from it. This means my result set is statistically insignificant – aversely, proving statistical significance is one of the major burdens of proof when presenting statistical summaries (or ought to be) and a major downfall of many popular infographics and marketing-led datagrams.
So, sampling in this way (called systematic sampling) is effective, but only for a statistically significant population. There are factors such as periodicity and proportion that can ruin a sample – let’s see proportion in action by taking a sample of 10 cities from the Person.Address table, by using the following code, which gets a distinct list of cities from the Person.Address table, then selects 10 cities from that list using systematic sampling:
;WITH    cities AS (
            SELECT DISTINCT City FROM Person.Address ),
        orderedCities AS (
            SELECT    ROW_NUMBER() OVER ( ORDER BY City ASC ) [RowId], City
            FROM    cities  )
SELECT        City
FROM        orderedCities
WHERE        RowId % ( SELECT MAX(RowId) / 10 FROM orderedCities ) = 0
ORDER BY    City ASC
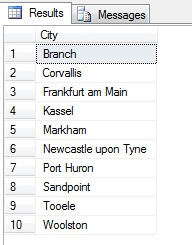
Looks like a good sample, right? Now let’s contrast it against a sample of NON-distinct cities listed in ascending order i.e. every nth city, where n is the total count of rows divided by 10. This measure takes into account sample population:
;WITH    cities AS (
            SELECT City, COUNT(*) [x] FROM Person.Address GROUP BY City),
        orderedCities AS (
            SELECT    ROW_NUMBER() OVER ( ORDER BY City ASC ) [RowId], City
            FROM    cities  )
SELECT        o.City, c.x [Count]
FROM        orderedCities o INNER JOIN cities c ON o.City = c.City
WHERE        RowId % ( SELECT MAX(RowId) / 10 FROM orderedCities ) = 0
ORDER BY    City ASC

The data returned is completely different – not through chance, but by presentation of a representative sample. Note this list, on which I’ve included the counts of each city in the source table to outline how much population plays a part in data selection, includes the top four most heavily populated cities in the sample, which (if you consider an ordered non-distinct list) is the fairest representation. It is not necessarily the best representation for your needs, so be careful when choosing your statistical sampling method.
Other Sampling Methods
Cluster sampling – this is where the population to be sampled is divided into clusters, or subsets, then each of these subsets is randomly determined to be included or not in the output result set. If included, every member of that subset is returned in the result set. See TABLESAMPLE below for an example of this.
Disproportional Sampling – this is like stratified sampling, where members of subset groups are selected in order to represent the whole group, but instead of being in proportion, there may be different numbers of members from each group selected to equalize the representation from each group. I.e. given the cities in Person.Address in the example from the section above, the first result set was disproportionate as it didn’t take into account population, but the second result set was proportionate as it represented the number of city entries in the Person.Address table. This type of sampling is in fact useful if a particular category is under-represented in the data set, and proportion is not important (for example, 100 random customers from 100 random cities stratified by city – the cities in the subset would need normalization – disproportionate sampling might be used).
SQL Server Random Data with TABLESAMPLE
SQL Server helpfully comes with a method of sampling data. Let’s see it in action. Use the following code to return approximately 100 rows (if it returns 0 rows, re-run – I’ll explain in a moment) of data from dbo.RandomData that we defined earlier.
SELECT    SomeDateTime, SomeVarchar, SomeBit
FROM    dbo.RandomData TABLESAMPLE ( 100 ROWS )
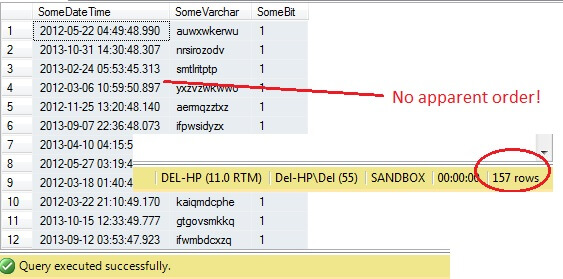
So far, so good, right? Hold on – we can’t see the Id column. Let’s include this and re-run:
SELECT    RowId, SomeDateTime, SomeVarchar, SomeBit
FROM    dbo.RandomData TABLESAMPLE ( 100 ROWS )

Oh dear – TABLESAMPLE has selected a slice of data, but it isn’t random – the RowId shows a clearly delineated slice with a minimum and a maximum value. What’s more, it hasn’t returned exactly 100 rows, either. What’s going on?
TABLESAMPLE uses the implied SYSTEM modifier. This modifier, on by default and an ANSI-SQL specification i.e. not optional, will take each 8KB page that the table resides on and decide whether or not to include all rows on that page that are in that table in the sample produced, based on the percentage or N ROWS passed in. Hence, a table that resides on many pages i.e. has large data rows should return a more randomized sample since there will be more pages in the sample. It fails for an example like ours, where the data is scalar and small and resides on just a few pages – if any number of pages fail to make the cut, this can significantly skew the output sample. This is the downfall of TABLESAMPLE – it doesn’t work well for ‘small’ data and it doesn’t take into account distribution of the data on the pages. So the arrangement of data on pages is ultimately responsible for the sample returned by this method.
Does this sound familiar? It is essentially cluster sampling, where all members (rows) in the selected groups (clusters) are represented in the result set.
Let’s test it on a large table to emphasize the point of inverse non-scalability. Let’s first identify the largest table in the AdventureWorks database. We’ll use a standard report for this – using SSMS, right-click on the AdventureWorks2012 database, go to Reports -> Standard Reports -> Disk Usage by Top Tables. Order by Data(KB) by clicking on the column header (you might wish to do this twice for descending order). You will see the report below.
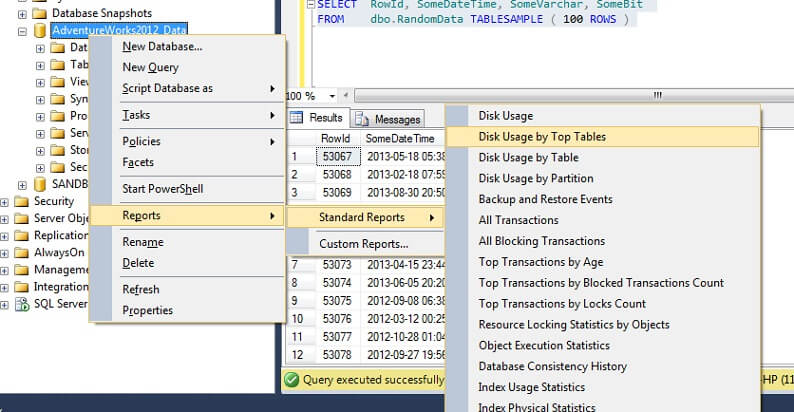

I’ve circled the interesting figure – the Person. Person table consumes 30.5MB of data and is the largest (by data, not record count) table. So let’s try taking a sample from this table instead:
USE        AdventureWorks2012_Data
SELECT    *
FROM    Person. Person TABLESAMPLE ( 100 ROWS )

You can see we’re much closer to 100 rows, but crucially, there doesn’t appear to be much clustering on the primary key (although there is some, as there are more than 1 row per page).
Consequently, TABLESAMPLE is good for big data, and gets catastrophically worse the smaller the dataset. This is no good for us when sampling from stratified data or clustered data, where we’re taking many samples from small groups or subsets of data then aggregating those. Let’s look at an alternative method, then.
Random SQL Server Data with ORDER BY NEWID()
Here’s a quote from BOL about getting a truly random sample:
“If you really want a random sample of individual rows, modify your query to filter out rows randomly, instead of using TABLESAMPLE. For example, the following query uses the NEWID function to return approximately one percent of the rows of the Sales.SalesOrderDetail table:
SELECT * FROM Sales.SalesOrderDetail
WHERE 0.01 >= CAST(CHECKSUM(NEWID(), SalesOrderID) & 0x7fffffff AS float)
/ CAST (0x7fffffff AS int)
The SalesOrderID column is included in the CHECKSUM expression so that NEWID() evaluates once per row to achieve sampling on a per-row basis. The expression CAST(CHECKSUM(NEWID(), SalesOrderID) & 0x7fffffff AS float / CAST (0x7fffffff AS int) evaluates to a random float value between 0 and 1.”
http://technet.microsoft.com/en-us/library/ms189108(v=sql.105).aspx
How does this work? Let’s split out the WHERE clause and explain it.
The CHECKSUM function is calculating a checksum over the items in the list. It is arguable over whether SalesOrderID is even required, since NEWID() is a function that returns a new random GUID, so multiplying a random figure by a constant should result in a random in any case. Indeed, excluding SalesOrderID seems to make no difference. If you are a keen statistician and can justify the inclusion of this, please use the comments section below and let me know why I’m wrong!
The CHECKSUM function returns a VARBINARY. Performing a bitwise AND operation with 0x7fffffff, which is the equivalent of (111111111…) in binary, yields a decimal value that is effectively a representation of a random string of 0s and 1s. Dividing by the co-efficient 0x7fffffff effectively normalizes this decimal figure to a figure between 0 and 1. Then to decide whether each row merits inclusion in the final result set, a threshold of 1/x is used (in this case, 0.01) where x is the percentage of the data to retrieve as a sample.
Confused? Read up on bitwise operators here -> http://technet.microsoft.com/en-us/library/aa276873(v=sql.80).aspx , hex to decimal conversion here -> http://www.wikihow.com/Convert-Hexadecimal-to-Binary-or-Decimal and a simple formula to help you reduce a range to between an upper and lower bound (proportional shrinking of a range of numbers, or normalization) http://stn.spotfire.com/spotfire_client_help/norm/norm_scale_between_0_and_1.htm.
Be wary that this method is a form of random sampling rather than systematic sampling, so you are likely to get data from all parts of your source data, but the key here is that you *may not*. The nature of random sampling means that any one sample you collect may be biased towards one segment of your data, so in order to benefit from regression to the mean (tendency towards a random result, in this case) ensure you take multiple samples and select from a subset of these, if your results look skewed. Alternatively, take samples from subsets of your data, then aggregate these – this is another type of sampling, called stratified sampling.
How do SQL Server statistics get sampled?
In SQL Server, automatic update of column or user-defined statistics takes place whenever a set threshold of table rows are changed for a given table. For 2012, this threshold is calculated at SQRT(1000 * TR) where TR is the number of table rows in the table. Prior to 2005, the automatic update statistics job will fire for every (500 rows + 20% change) of table rows. Once the auto update process starts, the sampling will *reduce the number of rows sampled the larger the table gets*, in other words there is a relationship that is similar to inverse proportion between the table sampling percentage and the size of the table, but follows a proprietary algorithm.
Interestingly, this appears to be the opposite of the TABLESAMPLE (N PERCENT) option, where the rows sampled is in normal proportion to the number of rows in the table. We can disable auto statistics (be careful doing this) and update statistics manually – this is achieved by using NORECOMPUTE on the UPDATE STATISTICS statement. With UPDATE STATISTICS we can override some of the options – for example, we can choose to sample N rows, or N percent (similar to TABLESAMPLE), perform a FULLSCAN, or simply RESAMPLE using the last known rate.
Next Steps
For further reading, Joseph Sack is a Microsoft MVP known for his work in statistical analysis of SQL Server – please see below for some links to his work, together with some references to work used for this article and to some related tips from MSSQLTips.com. Thanks for reading!
- Retrieving random data from SQL Server with TABLESAMPLE – Greg Robidoux https://www.mssqltips.com/sqlservertip/1308/retrieving-random-data-from-sql-server-with-tablesample/
- Statistical Sampling (V. Easton, J. McColl, University of Glasgow) http://www.stats.gla.ac.uk/steps/glossary/sampling.html
- Limiting Result Sets by using TABLESAMPLE (Microsoft TechNet) http://technet.microsoft.com/en-us/library/ms189108(v=sql.105).aspx
- UPDATE STATISTICS (BOL): http://technet.microsoft.com/en-us/library/ms187348.aspx
- Bitwise Operators (full list in pane on left): http://technet.microsoft.com/en-us/library/aa276873(v=sql.80).aspx
- Equation for normalizing a range: http://stn.spotfire.com/spotfire_client_help/norm/norm_scale_between_0_and_1.htm
- Querying SQL Server index statistics (Dattatrey Sindol): https://www.mssqltips.com/sqlservertip/2979/querying-sql-server-index-statistics/

Dr. Derek Colley is the lead technical consultant for Optimal Computing, a boutique data consultancy based in the UK NW helping clients troubleshoot, configure, plan and deploy their data platforms. He specializes in data integration and database performance optimization, and is a PhD candidate with Staffordshire University, looking into methods of integrating AL query selection algorithms with the cost-based query optimizer. In his spare time, he enjoys building robots, going outdoors, and spending time with his four children.
- MSSQLTips Awards: Trendsetter (25+ tips)


