By: Derek Colley | Comments (13) | Related: > Compression
Problem
You are a DBA or developer mulling over data compression options in SQL Server. You wish to know how much space compressing a particular index will save; you need to know how this will affect query performance.
Solution
This article goes beyond some of the excellent descriptions of row- and page-level data compression options in SQL Server literature and demonstrates the effects of applying these options to moderately-sized data sets. For the demonstrations and to help benchmark your own experiments, I am using SQL Server 2012 RTM Developer Edition on Windows 7 Professional 64-bit, 4 cores @ 2.4GHz, memory capped in SQL Server to a maximum of 2GB for the instance.
Setup
For the setup, I am using a table of two million rows, two columns - an ID column (identity) and a fixed-length CHAR(100) column. The CHAR column contains the letter 'A' 50 times. On the millionth row ordered by UQID, instead of 'AAAA...AAA', is the word 'Bazinga!'. The benchmark is to measure how quickly 'Bazinga!' is found, and how much I/O is involved, in a table scan when the table is not compressed; compressed using row-level compression, and compressed using page-level compression.
Let us first set up the environment. Create a database called SANDBOX (or modify the code to use your preferred test environment) and issue this:
USE MASTER
GO
ALTER DATABASE SANDBOX SET RECOVERY SIMPLE
GO
CHECKPOINT
USE SANDBOX
SET NOCOUNT ON
GO
IF EXISTS ( SELECT t.name
   FROM sys.tables t
   INNER JOIN sys.schemas s ON t.schema_id = s.schema_id
   WHERE t.name = 'TestData' AND s.name = 'dbo' )
 DROP TABLE dbo.TestData
CREATE TABLE dbo.TestData (
 UQID INT IDENTITY(1,1) NOT NULL,
 SomeCharData CHAR(100) )
GO
INSERT INTO dbo.TestData
 SELECT REPLICATE('A', 50)
GO 999999
INSERT INTO dbo.TestData
 SELECT 'Bazinga!'
GO
INSERT INTO dbo.TestData
 SELECT REPLICATE('A', 50)
GO 1000000
This will create the table to use and will take around ten minutes to run (see above) depending on your system specifications. You can check on the progress in a separate query window by running:
SELECT COUNT(*) FROM SANDBOX.dbo.TestData WITH (NOLOCK)
Next, clear the procedure cache and drop clean memory buffers to 'clear the decks' ready for an unbiased test:
DBCC FREEPROCCACHE
DBCC DROPCLEANBUFFERS
GO
Experimentation - No Compression
I then issued the following query to retrieve the row number of the row that has a value 'Bazinga!' in the SomeCharData column.
SELECT UQID
FROM dbo.TestData
WHERE SomeCharData = 'Bazinga!'
GO
Here's the execution plan. You can see there are three elements - the table scan, the parallelism gather streams, and the SELECT.
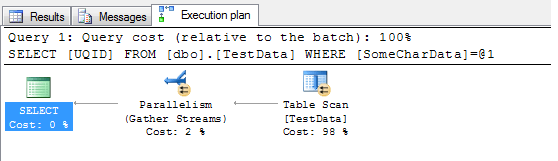
Now, I don't particularly want parallelism in this case - as I found earlier when experimenting, parallelism will be invoked when the optimizer decides that a parallel query will run faster than a serial query and that the query exceeds the cost threshold for parallelism. This could skew my results if parallelism is invoked for one type of compression but not another (as I observed during testing). Therefore, I'm going to limit the query to one processor by overriding the optimizer with a query hint:
SELECT UQID
FROM dbo.TestData
WHERE SomeCharData = 'Bazinga!' WITH OPTION (MAXDOP 1)
GO

This yields a straightforward execution plan with a table scan and SELECT. To keep these tests fair and try to ensure a good statistical sample, I ran this test 15 times, clearing the caches each time. Here are the results collected using SET STATISTICS io ON and SET STATISTICS time ON:
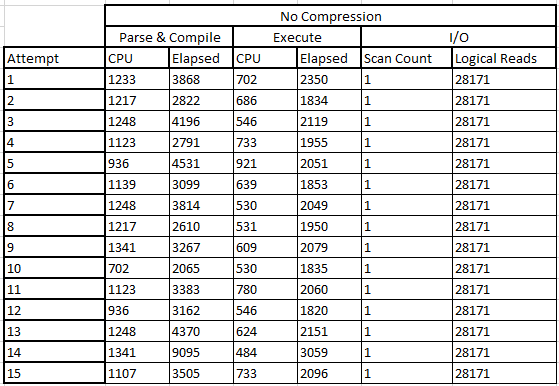
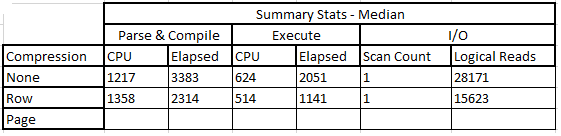
The median of these figures is shown below. I chose the median as the range of each set of values was quite tight and I didn't want any outliers to skew the result, nor decimal places:
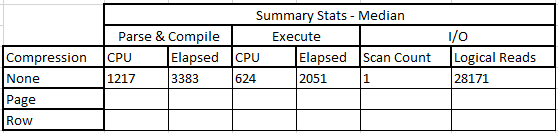
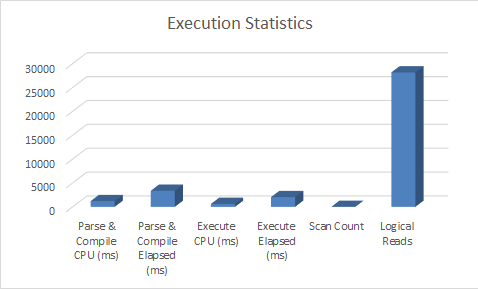
So it's not a bad result, overall. 1.217 seconds in CPU time and 3.38 seconds total time to parse and compile the query, and 0.624 seconds on the CPU with 2.05 seconds to execute the query, a total execution time of 5.43 elapsed seconds. Let's put this on a graph.
Now, let's rebuild the table to use row-level compression.
Refresher - Compression Options
Just a quick refresher now for anyone not immediately familiar with compression - I shall attempt to do it justice. Data compression comes in two forms in SQL Server 2012 (actually three, including Unicode, but this isn't a separate option) - row-level compression, and page-level compression. Row-level compression compresses data at row level by applying algorithms to reduce the size of the data encountered. For example, it will convert a fixed-length CHAR to a VARCHAR. Row-level compression is included in page-level compression, but page-level compression uses two other techniques too - prefix compression (finding common values for data in a column) and dictionary compression (finding common values across columns). It is implemented during table definition, but you can also implement it using a REBUILD statement.
Experimentation - Row-Level Compression
Okay, let's move on now and rebuild the table with row-level compression. This is surprisingly simple to do. I will rebuild the table and also clear the caches again following our last query (to remove the plan from cache which will bias the results):
ALTER TABLE dbo.TestData REBUILD WITH ( DATA_COMPRESSION = ROW )
GO
DBCC FREEPROCCACHE
DBCC DROPCLEANBUFFERS
GO
This should only take a few seconds to run. Let's now look at the execution plan for the query to ensure it's the same as when using no compression at all:

Let's compare the properties of each element of the execution plan, from when we executed the query without compression and executing with compression. Do the properties (and these are actual execution plans as opposed to estimated ones) reflect any different values considering the compression method differs?
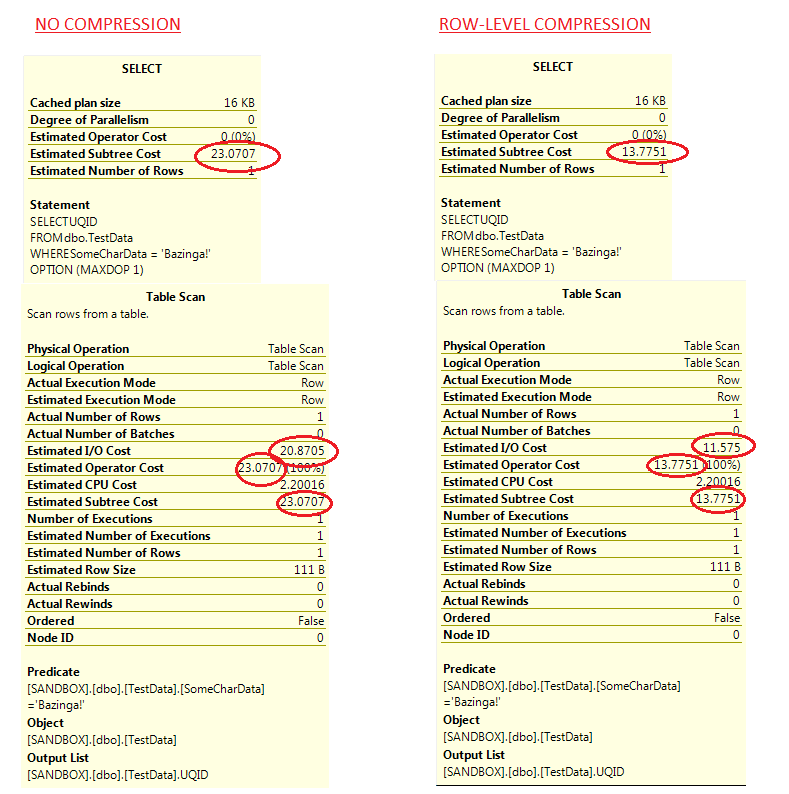
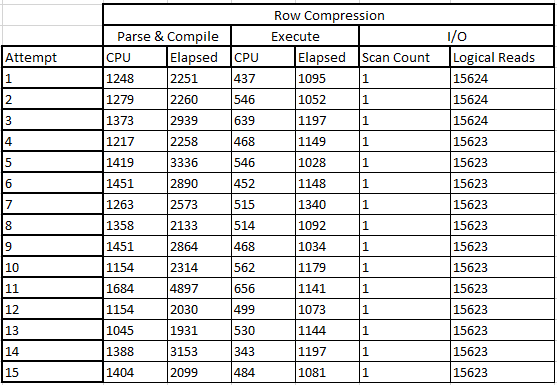
This is interesting - we can already see from the execution plans that there's likely to be a drop in I/O consumption from using row-level compression. This would make sense - if there's less physical data to read, there's less I/O. I ran this experiment 15 times - here's the results below:
And here's the median results, alongside the non-compressed results:
Here's the clustered bar graph, for visual comparison:
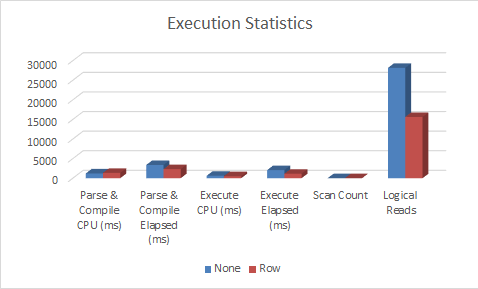
This is really interesting - we can see that the time on the CPU to parse and compile increased slightly, with a decrease in the actual elapsed time. In the logical reads there's a reduction, which came down significantly - by nearly 50%. These savings all represent savings in query execution time at a slight cost in CPU time. We'll see how this compares to page-level compression.
Experimentation - Page-Level Compression
Let's move on to the final stage in our experimentation. Let's once again rebuild the table, this time with page-level compression, and clear the caches:
ALTER TABLE dbo.TestData REBUILD WITH ( DATA_COMPRESSION = PAGE )
GO
DBCC FREEPROCCACHE
DBCC DROPCLEANBUFFERS
GO
Let's remind ourselves of the query - you'll note I've not overridden the parallelism this time, you'll see why in a moment:
SELECT UQID
FROM dbo.TestData
WHERE SomeCharData = 'Bazinga!'
GO
Now we can look at the execution plan for the query and see if it remains the same (on the surface):

It does - and without overriding parallelism, it chooses to use serial execution. Why? I would speculate this is because the default cost threshold for parallelism is set to 5, and I haven't changed it in my installation of SQL Server. Let's check the properties - we'll put them side-by-side with row compression as we did with no compression/row compression earlier to see how they compare. I've circled the interesting stats including the operator cost, which is indeed under 5:
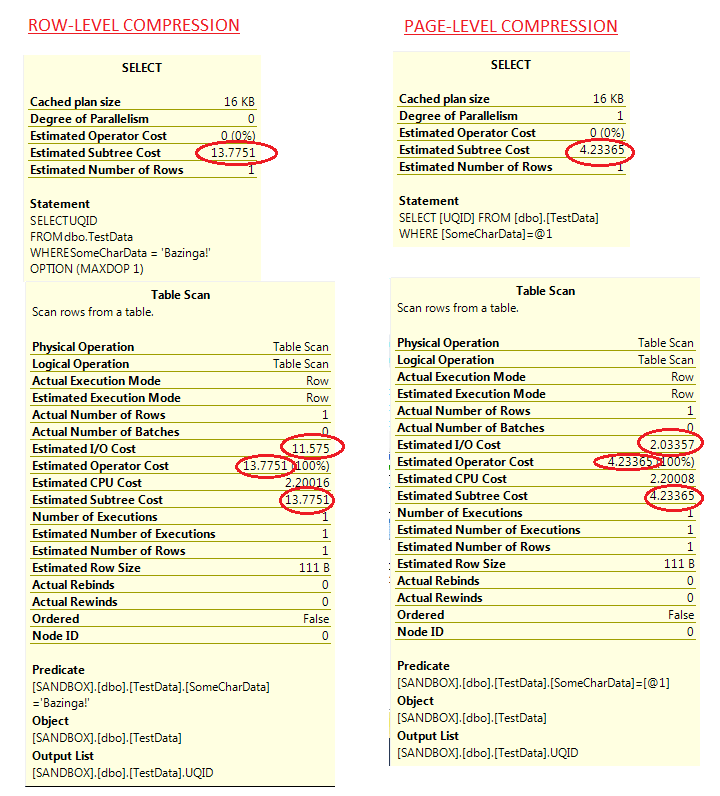
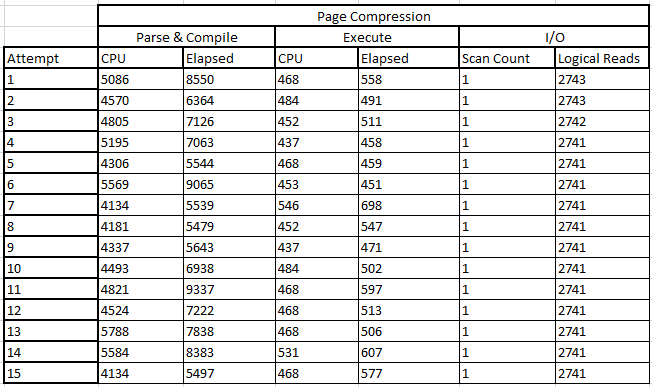
For this reason, we'll execute the query without overriding parallelism 15 times as before, and examine the results. The properties above seem to imply we'll use even LESS I/O than before (see circled values), so let's see if this bears out. Here are the results:
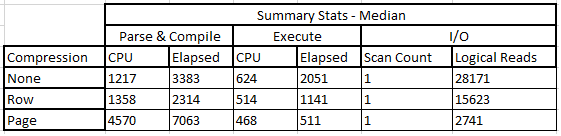
And here are the median values, as compared to the no-compression and row-compression median statistics. As you can see, CPU has risen significantly on parse and compile, nearly four times the CPU use without compression at all and more than three times row compression - but with a slight reduction on CPU during execution. But look at the reduced I/O - more than 90% improvement on not using compression at all (bear in mind my data was all 'A's! YMMV) and a huge improvement on I/O against row-level compression. Interesting that row-level compression couldn't achieve better savings but as we know, prefix- and dictionary-level compression techniques apply only to page-level compression, so the savings on row-level likely came from the CHAR- to VARCHAR conversion and the 50% saving on character space.
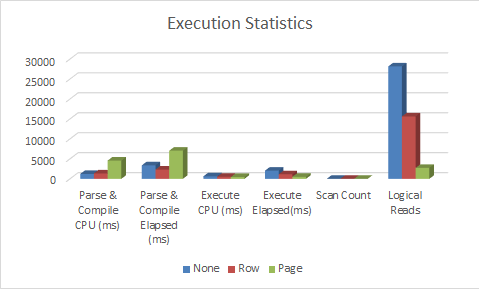
Here's the bar graph to see how it all compares:
Using Estimations
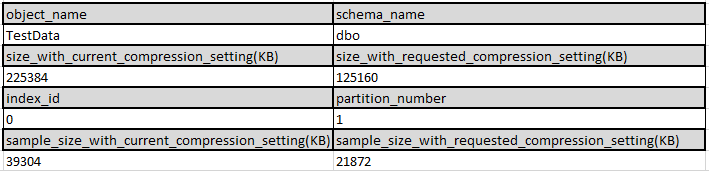
You'll be glad to know that to estimate the savings from row- and page-level compression, you don't need to go through all this (although it's thorough if you do!). There's a handy system stored procedure you can use, supplied as part of SQL Server, called sp_estimate_data_compression_savings. Call it like this:
EXEC sp_estimate_data_compression_savings
 @schema_name = 'dbo',
 @object_name = 'TestData',
 @index_id = 0,
 @partition_number = 1,
 @data_compression = 'row'
GO
Here are the results of row-level estimations. As you can see, the space estimations are extremely close to those values actually observed (there is a small difference):
And here are the results of page-level estimations - again, the variation in space saving is very close to our results:
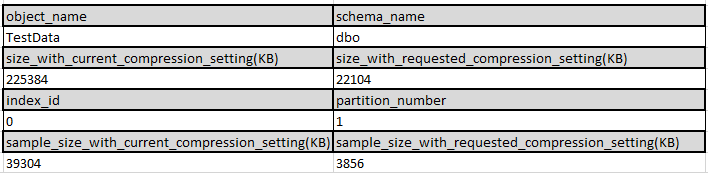
Be careful though - what this stored procedure DOESN'T tell you is that CPU use will significantly increase - as we saw, by nearly a factor of four times in the experiments between no compression and page compression! Use this stored procedure - but conduct your own testing too.
Conclusion
As we can see, row- and page-level compression can be powerful tools to help you reduce space taken by your data and improve the execution speed, but at the expense of CPU time. This is because each access of a row or page requires a step to undo the compression (or calculate and match hashes) and this translates directly into compute time. So, when deploying row- or page-level compression, conduct some similar testing (you are welcome to use my framework!) and see how it plays out in your test environment. Your results should inform your decision - if you're already CPU-bound, can you afford to deploy this? If your storage is on fire, can you afford NOT to?
Next Steps
You can find some excellent further reading using the resources below:
- Simmons, K. and Carstarphen, S. (2012) Pro SQL Server 2012 Administration, 2nd Edition, Apress (pp.200-202) ISBN 978-1-4302-3915-4
- MSSQLTips.com - 'Implementing Data Compression in SQL Server 2008' - Edwin Sarmiento, http://www.mssqltips.com/sqlservertip/1582/implementing-data-compression-in-sql-server-2008/
- MSSQLTips.com - 'SQL Server 2012 Partitioned Index Compression Comparison' - Dr. Dallas Snider, http://www.mssqltips.com/sqlservertip/3033/sql-server-2012-partitioned-index-compression-comparison/


About the author
 Dr. Derek Colley is a UK-based DBA and BI Developer with more than a decade of experience working with SQL Server, Oracle and MySQL.
This author pledges the content of this article is based on professional experience and not AI generated.
View all my tips
