Problem
The output from the Association Rules data mining model in SQL Server Analysis Services can be difficult to understand in terms of the calculations named probability and importance, especially when the generated rules become more complex. In this tip we go through an example to provide a better understanding.
Solution
In this tip, we show how the Association Rules mining model calculates the probability and importance displayed in the mining model viewer for more complex association rules. In a previous tip, I presented a SQL Server 2012 Analysis Services Association Rules data mining example along with how the probability and importance are calculated for a simple rule. The aforementioned tip will be our starting point for this demonstration. The solution presented here uses data from a banking example provided by Bamshad Mobasher at DePaul University.
To calculate the importance value, we need the count of four different sets of records.
(The antecedent is also known as the precondition and the consequent is also known as the conclusion.)
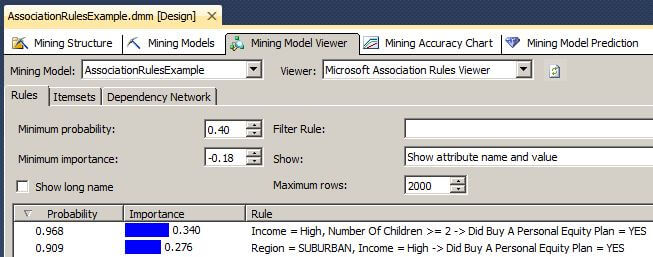
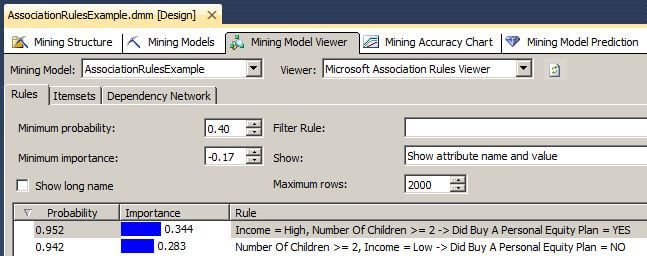
In the image of the Mining Model Viewer below, we see two sets of rules with their values of Probability and Importance. In the first rule, the antecedent A is Income = High and Number of Children >= 2. The consequent for the first rule is Did Buy A Personal Equity Plan = YES, which we will treat as positive for all rules. For this first rule the antecedent NOT A is Income <> High OR Number of Children < 2. Please note the OR in the previous sentence because it will be very important in our calculations below. The negative consequent is Buy A Personal Equity Plan = NO, which we will treat as negative for all rules.
The T-SQL below shows how the Importance is calculated.
declare @HiIncomeAnd2PlusKidsYesCount float
declare @NotHiIncomeOr0To1KidsNoCount float
declare @HiIncomeAnd2PlusKidsNoCount float
declare @NotHiIncomeOr0To1KidsYesCount float
declare @Numerator float
declare @Denominator float
— The algorithm adds one to each count to prevent divide by zero errors
— The count where the antecedent is A and the consequent is positive.
set @HiIncomeAnd2PlusKidsYesCount=
(
select cast(count(*)+1 as float)
from dbo.tblAssociationRulesExample
where Income=’HIGH’
and NumberOfChildren>=2
and DidBuyAPersonalEquityPlan=’YES’
)
–The count where the antecedent is NOT A and the consequent is negative.
set @NotHiIncomeOr0To1KidsNoCount=
(
select cast(count(*)+1 as float)
from dbo.tblAssociationRulesExample
where
(Income<>’HIGH’ OR NumberOfChildren<2)
and DidBuyAPersonalEquityPlan=’NO’
)
–The count where the antecedent is A and the consequent is negative.
set @HiIncomeAnd2PlusKidsNoCount=
(
select cast(count(*)+1 as float)
from dbo.tblAssociationRulesExample
where Income=’HIGH’
and NumberOfChildren>=2
and DidBuyAPersonalEquityPlan=’NO’
)
–The count where the antecedent is NOT A and the consequent is positive.
set @NotHiIncomeOr0To1KidsYesCount=
(
select cast(count(*)+1 as float)
from dbo.tblAssociationRulesExample
where (Income<>’HIGH’ OR NumberOfChildren<2)
and DidBuyAPersonalEquityPlan=’YES’
)
–echo the values
select @HiIncomeAnd2PlusKidsYesCount as HiIncomeAnd2PlusKidsYes,
@NotHiIncomeOr0To1KidsNoCount as NotHiIncomeOr0To1KidsNo,
@HiIncomeAnd2PlusKidsNoCount as HiIncomeAnd2PlusKidsNo,
@NotHiIncomeOr0To1KidsYesCount as NotHiIncomeOr0To1KidsYes
set @Numerator=(select @HiIncomeAnd2PlusKidsYesCount/
(@HiIncomeAnd2PlusKidsYesCount+@HiIncomeAnd2PlusKidsNoCount))
set @Denominator=(select @NotHiIncomeOr0To1KidsYesCount/
(@NotHiIncomeOr0To1KidsYesCount+@NotHiIncomeOr0To1KidsNoCount))
select @Numerator as Numerator,
@Denominator as Denominator,
@Numerator/@Denominator as Quotient
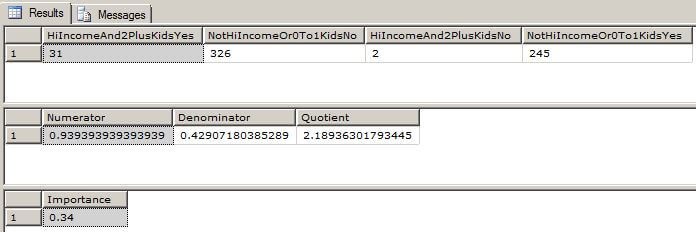
select round(LOG10(@Numerator/@Denominator),3) as Importance
The output of the above T-SQL code is shown here. Notice how the Importance calculation matches the value in the Mining Model Viewer screen shot above.
The T-SQL below shows how the Probability is calculated for the first rule shown.
declare @AntecedentA_PositiveCount float
declare @AntecedentACount float
–Get the total count for the rule AntecedentA implies DidBuyAPersonalEquityPlan=’YES’
set @AntecedentA_PositiveCount=
(
select cast(count(*) as float)
from dbo.tblAssociationRulesExample
where Income=’HIGH’
and NumberOfChildren>=2
and DidBuyAPersonalEquityPlan=’YES’
)
–Get the total count for all AntecedentA
set @AntecedentACount=
(
select cast(count(*) as float)
from dbo.tblAssociationRulesExample
where Income=’HIGH’
and NumberOfChildren>=2
)
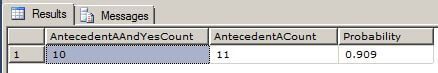
select @AntecedentA_PositiveCount as AntecedentAAndYesCount,
@AntecedentACount as AntecedentACount,
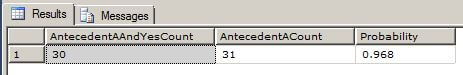
round(@AntecedentA_PositiveCount/@AntecedentACount,3) as Probability
The output of this query is shown here. Notice how the probability calculated here matches the probability shown in the Mining Model Viewer above.
To validate the accuracy of the calculations, we run the following T-SQL queries for the second rule displayed above. In the second rule, the antecedent A is Income = High and Region = Suburban. The antecedent NOT A is Income <> High OR Region <> Suburban. Again, please note the OR in the previous sentence because it will be very important in our calculations below.
declare @HiIncomeAndSuburbanYesCount float
declare @NotHiIncomeOrNotSuburbanNoCount float
declare @HiIncomeAndSuburbanNoCount float
declare @NotHiIncomeOrNotSuburbanYesCount float
declare @Numerator float
declare @Denominator float
— The algorithm adds one to each count to prevent divide by zero errors
— The count where the antecedent is A and the consequent is positive.
set @HiIncomeAndSuburbanYesCount=
(
select cast(count(*)+1 as float)
from dbo.tblAssociationRulesExample
where Income=’HIGH’
and Region=’Suburban’
and DidBuyAPersonalEquityPlan=’YES’
)
–The count where the antecedent is NOT A and the consequent is negative.
set @NotHiIncomeOrNotSuburbanNoCount=
(
select cast(count(*)+1 as float)
from dbo.tblAssociationRulesExample
where
(Income<>’HIGH’ OR Region<>’Suburban’)
and DidBuyAPersonalEquityPlan=’NO’
)
–The count where the antecedent is A and the consequent is negative.
set @HiIncomeAndSuburbanNoCount=
(
select cast(count(*)+1 as float)
from dbo.tblAssociationRulesExample
where Income=’HIGH’
and Region=’Suburban’
and DidBuyAPersonalEquityPlan=’NO’
)
–The count where the antecedent is NOT A and the consequent is positive.
set @NotHiIncomeOrNotSuburbanYesCount=
(
select cast(count(*)+1 as float)
from dbo.tblAssociationRulesExample
where (Income<>’HIGH’ OR Region<>’Suburban’)
and DidBuyAPersonalEquityPlan=’YES’
)
–echo the values
select @HiIncomeAndSuburbanYesCount as HiIncomeAndSuburbanYes,
@NotHiIncomeOrNotSuburbanNoCount as NotHiIncomeOrNotSuburbanNo,
@HiIncomeAndSuburbanNoCount as HiIncomeAndSuburbanNo,
@NotHiIncomeOrNotSuburbanYesCount as NotHiIncomeOrNotSuburbanYes
set @Numerator=(select @HiIncomeAndSuburbanYesCount/
(@HiIncomeAndSuburbanYesCount+@HiIncomeAndSuburbanNoCount))
set @Denominator=(select @NotHiIncomeOrNotSuburbanYesCount/
(@NotHiIncomeOrNotSuburbanYesCount+@NotHiIncomeOrNotSuburbanNoCount))
select @Numerator as Numerator,
@Denominator as Denominator,
@Numerator/@Denominator as Quotient
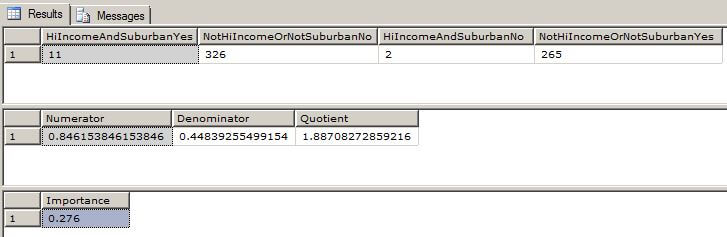
select round(LOG10(@Numerator/@Denominator),3) as Importance
The output of this query is shown here.
The T-SQL below shows how the Probability is calculated for the second rule shown.
declare @AntecedentA_PositiveCount float

declare @AntecedentACount float

–Get the total count for the rule Antecedent A implies DidBuyAPersonalEquityPlan=’YES’

set @AntecedentA_PositiveCount=

   (

      select cast(count(*) as float) from dbo.tblAssociationRulesExample

      where Income=’HIGH’

      and Region=’Suburban’

      and DidBuyAPersonalEquityPlan=’YES’

   )

–Get the total count for all Antecedent A

set @AntecedentACount=

   (

      select cast(count(*) as float) from dbo.tblAssociationRulesExample

      where Income=’HIGH’

      and Region=’Suburban’

   )

select @AntecedentA_PositiveCount as AntecedentAAndYesCount,

       @AntecedentACount as AntecedentACount,

       round(@AntecedentA_PositiveCount/@AntecedentACount,3) as Probability
The output of this query is shown here.
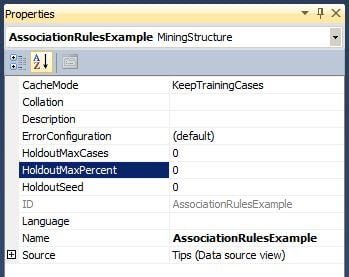
Please take note that the above examples hold true because the HoldoutMaxCases and HoldoutMaxPercent attributes are set to zero for the mining structure. The image below is from the Visual Studio Properties Window for the Mining Structure.
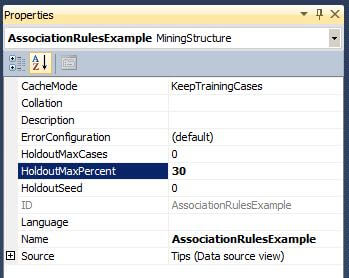
If the values for these attributes are not zero, then the query results will likely not match the figures in the Model Mining Viewer. When we set the value for HoldoutMaxPercent to 30 and then rebuild and deploy the mining structure, we see that our values for probability and importance have changed. With larger volumes of data, this change might not be as noticeable.
Next Steps
Explore the different association rules in the Mining Model Viewer to discover interesting patterns in the data. Also, be sure to read the following tips to find out more about data mining functionality in SQL Server 2012 Analysis Services.

Dr. Dallas Snider is an Assistant Professor in the Computer Science Department at the University of West Florida. He received his Ph.D. in Integrated Computing and M.S. in Instrumental Sciences from the University of Arkansas at Little Rock. He received a B.A. in Physics from Hendrix College. Before joining UWF, he worked as a data warehouse developer for Northrop Grumman Information Systems and prior to that as a database application developer for Acxiom and Euronet. Dr. Snider’s teaching and research interests include data mining, data warehousing, information visualization, and software development.