Problem
How can I set up a project to use the SQL Server Analysis Services logistic regression data mining algorithm?
Solution
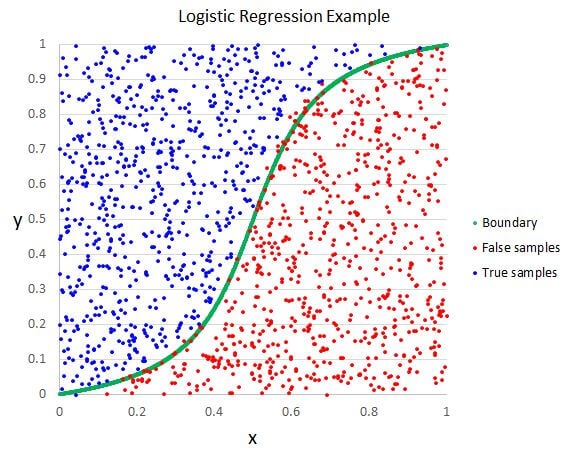
In this tip, we show how to create a simple data mining model using the Logistic Regression algorithm in SQL Server Analysis Services. The data set we will use is visualized below. We are trying to classify the false samples in red and the true samples in blue. This tip uses SQL Server 2014 Analysis Services and Visual Studio 2012.
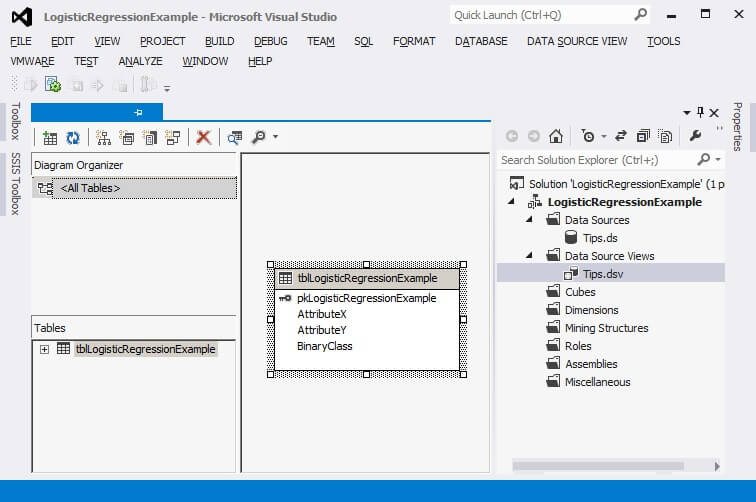
The data is stored in the table whose structure is shown below. We have a primary key column, along with columns for our X and Y values. The last column is where we store the class label.

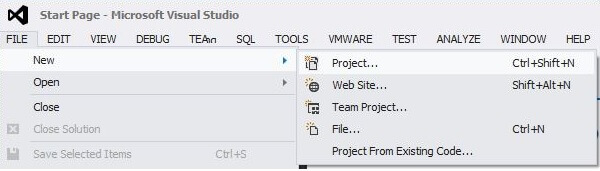
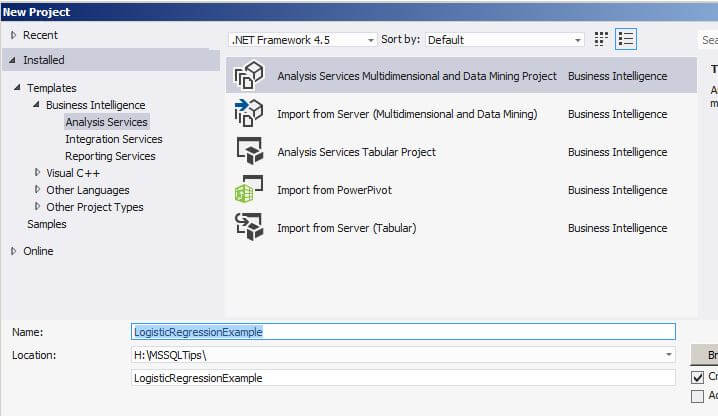
In Visual Studio, create a new Analysis Services Multidimensional and Data Mining Project.
In this tip, we will name the project LogisticRegressionExample. Click on OK when finished with the New Project window.
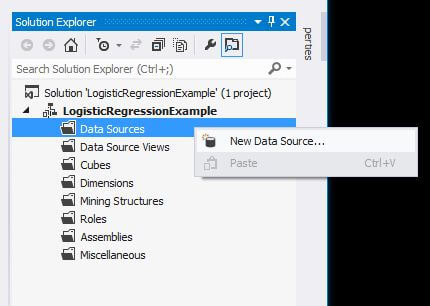
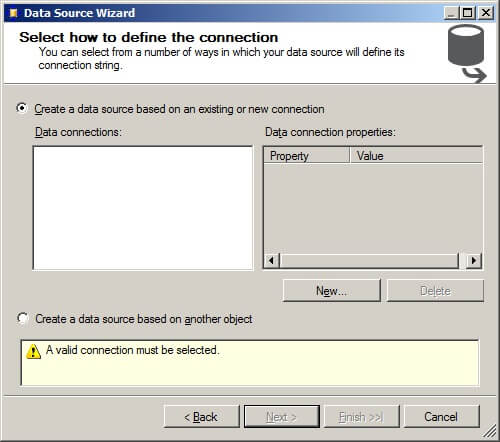
In the Solution Explorer window, right-click on the Data Sources folder and choose “New Data Source…” to initiate the Data Source Wizard.
Click on “Next >”.

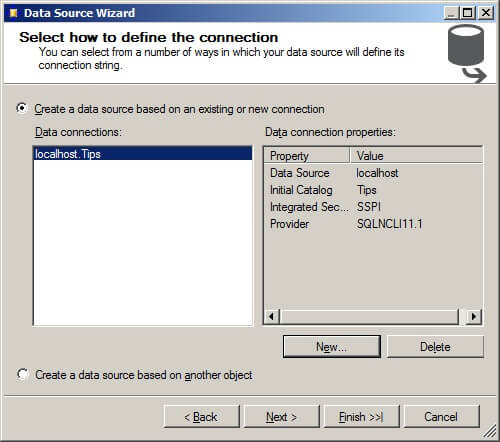
Choose your data connection, if one exists. If a data connection does not exist, click on “New…” to create a new data connection.
In this example, we are using a connection to the Tips database on the localhost.
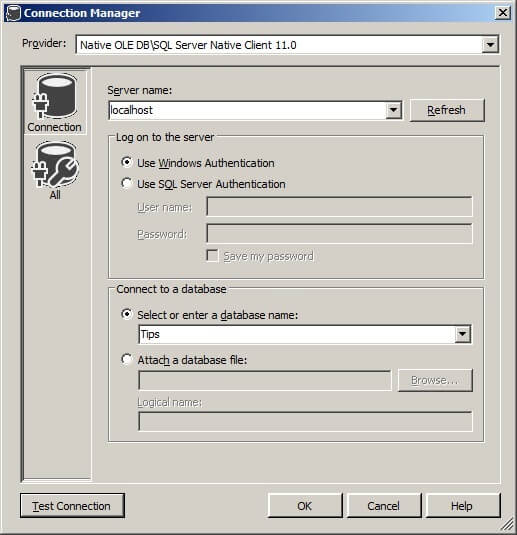
Click on “Next >”.
On the Impersonation Information screen, click on “Use a specific Windows user name and password.” Enter your username and password. Click on “Next >”.

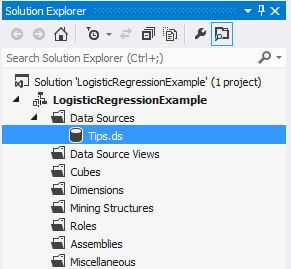
On the Completing the Wizard screen, the data source name can be changed if desired. Click on “Finish”.

The new data source will appear in the Solution Explorer.
In the Solution Explorer window, right-click on the Data Source Views folder and choose “New Data Source View…” to launch the Data Source View Wizard.

Click on “Next >”.

On the Select a Data Source page in the Relational data sources window, select the data source we created in the above step. Click on “Next >”.

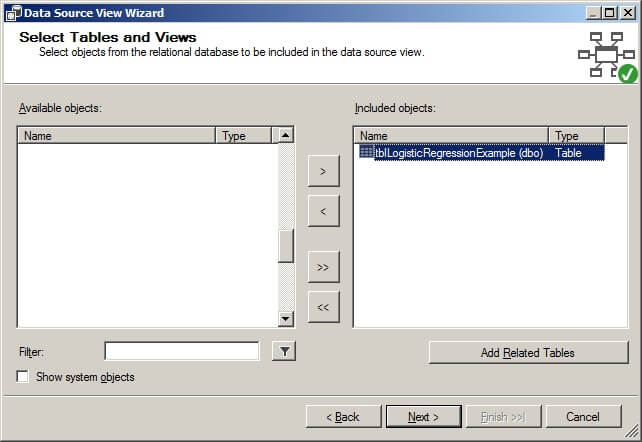
On the Select Tables and Views page, move the table tblLogisticRegressionExample from the Available Objects box to the Included object box by selecting tblLogisticRegressionExample in the Available objects box and then clicking on the “>” box. Click on “Next >”.
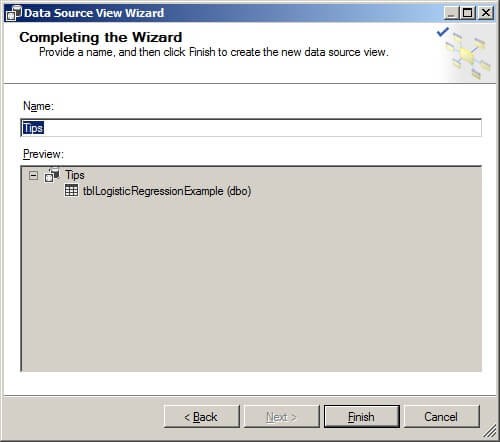
On the Completing the Wizard page, give the Data Source View a name and click on “Finish”.
The data source view now appears in the Solution Explorer window.
Right-click on the Mining Structures folder and select “New Mining Structure…” to launch the Data Mining Wizard.

Click on “Next >”.

Press the “From existing relational database or data warehouse” radio button and then click “Next >”.

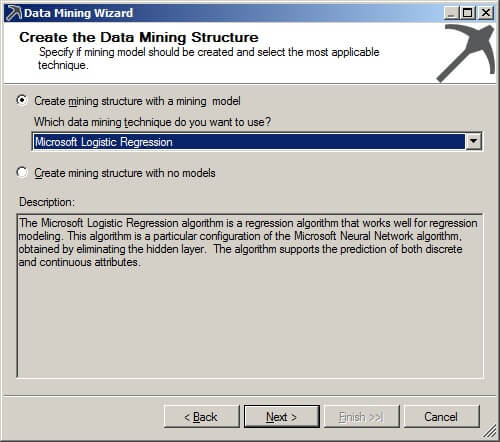
Select the Microsoft Logistic Regression as the data mining technique. Please note in the description that the “algorithm is a particular configuration of the Microsoft Neural Network algorithm.” This will become important later when it is time to view the results.
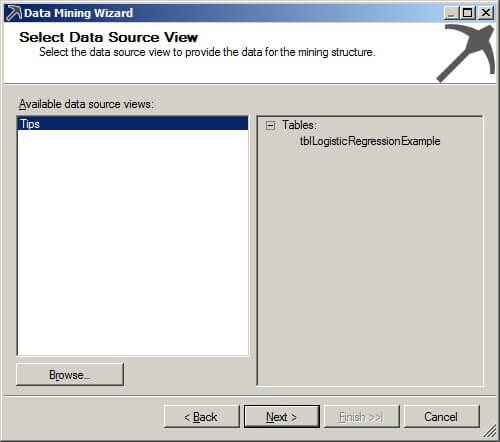
On the Select Data Source View page, we will use our previously defined objects. Click on “Next >”.
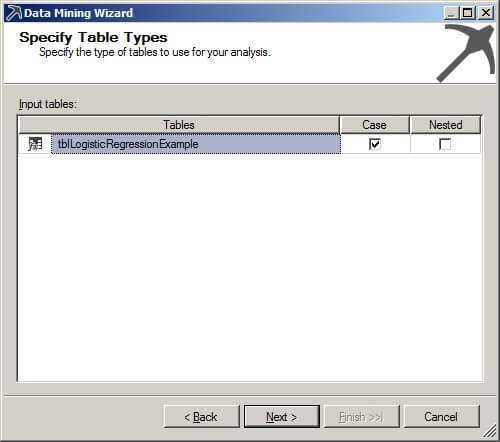
Next, check the Case box on the ColumnsForDataMining line. Click on “Next >”.
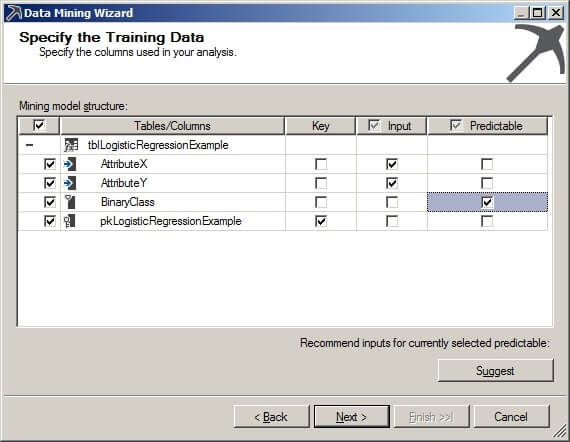
On the Specify the Training Data page, check the box in the Key column that corresponds with the primary key column. The AttributeX and AttributeY columns will be used as input. The BinaryClass column is our class label, so we check the Predictable box for the BinaryClass column. Click on “Next >”.
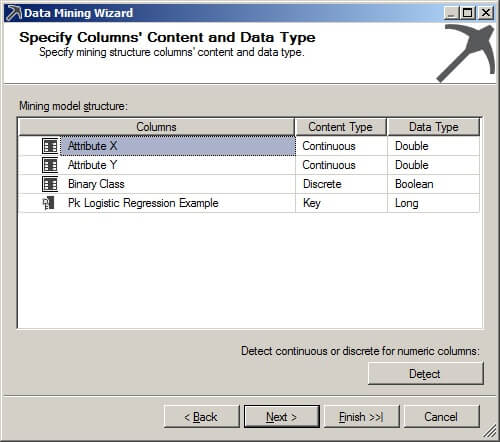
The default values are shown below on the Specify Columns’ Content and Data Type page. The values displayed in the Content Type and Data Type columns accurately represent the data in the source table. In this case, there is no need to click the Detect button. Click on “Next >.”
We will use 30% of our data for testing the mining model’s accuracy. Click on “Next >”.

On the Completing the Wizard screen, we can rename the mining structure name and the mining model name. Click on “Finish”.

Our mining structure now appears in the Solution Explorer.

The Mining Structure tab is selected by default. At this point the Analysis Services objects reside in the Visual Studio project and not on the server. Click on the Mining Model Viewer tab.

Visual Studio will attempt to deploy the SSAS objects to the server specified in the project properties. When asked if “Would you like to build and deploy the project first?”, choose “Yes”.

When given the warning about the time it could take to process the mining model and asked “Do you wish to continue?”, choose “Yes”. The number of records in the table is not a large amount, so it should not take more than a minute to process.

When the Process Mining Model window appears, press the “Run…” button.
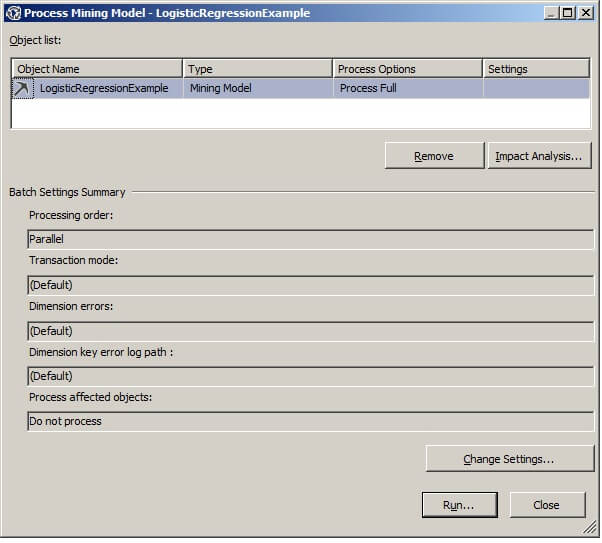
The Process Progress window will appear. When the process completes successfully select “Close” in the Process Progress window and “Close” again in the Process Mining Model window.

Depending on your hardware configuration, the Load Mining Model Content window might appear stating to “Please wait…”.

The Deployment Progress window will appear also stating that the SSAS objects were successfully deployed to the Analysis Services server.

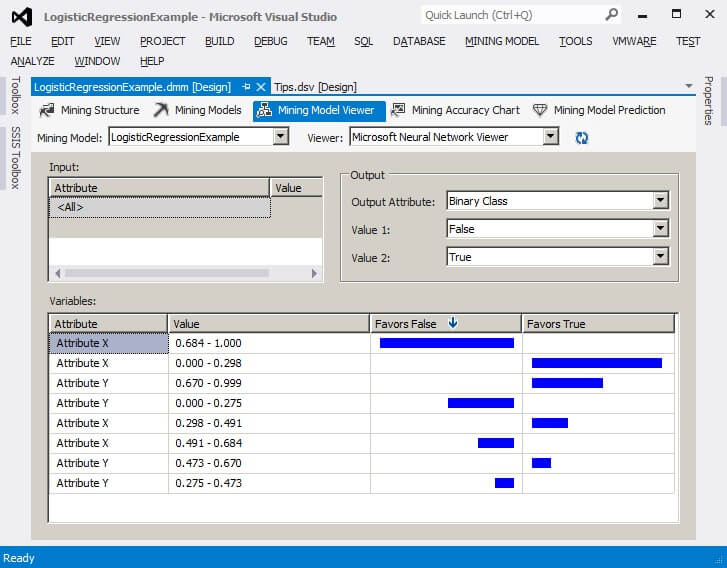
In the Mining Model Viewer tab, we can see which attributes and their values favor the False classification and which attributes and their values favor the True classification. The wider the blue bar indicates the higher likelihood that a specific key-value pair will favor a particular classification. In the example shown here, when AttributeX is 0.684 to 1.000 the classification tends to be False. When AttributeX is between 0.000 to 0.298, then the classification tends to be True. The Logistic Regression algorithm utilizes the Microsoft Neural Network Viewer.
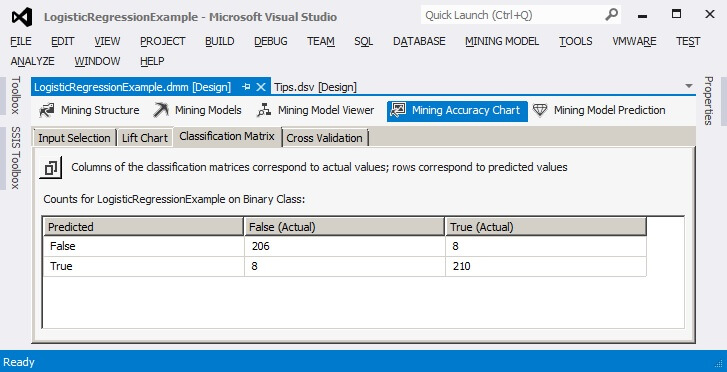
When we click on the Mining Accuracy Chart and then click on the Classification Matrix page, we can see the confusion matrix for the Logistic Regression algorithm. This displays the count of true positives, true negatives, false positives and false negatives in the 30% test population.
Summary
In this tip, we have provided an introduction to the Logistic Regression data mining algorithm in SQL Server 2014 Analysis Services.
Next Steps
Check out these other tips on data mining in SQL Server Analysis Services.
- Introduction to the SQL Server Analysis Services Neural Network Data Mining Algorithm
- SQL Server 2012 Analysis Services Association Rules Data Mining Example
- Explaining the Calculations of Probability and Importance for Complex Association Rules in SQL Server 2012 Analysis Services
- Classic Machine Learning Example In SQL Server Analysis Services
- Microsoft NaÏve Bayes Data Mining Model in SQL Server Analysis Services
- Data Mining Clustering Example in SQL Server Analysis Services SSAS
- SQL Server Analysis Services Glossary

Dr. Dallas Snider is an Assistant Professor in the Computer Science Department at the University of West Florida. He received his Ph.D. in Integrated Computing and M.S. in Instrumental Sciences from the University of Arkansas at Little Rock. He received a B.A. in Physics from Hendrix College. Before joining UWF, he worked as a data warehouse developer for Northrop Grumman Information Systems and prior to that as a database application developer for Acxiom and Euronet. Dr. Snider’s teaching and research interests include data mining, data warehousing, information visualization, and software development.