Problem
Often, as a SSRS developer, you will find that you have to be creative in order to get a report to display your data in just the exact way the report consumers want. Unfortunately, getting the data in the format needed is never easy and often times, getting the actual data is only a small part of the battle. Most often you will find yourself spending over 50% of your time getting everything looking just right, for instance getting all of one set of data on one page or within one column width. As datasets diverge, trying to keep the formatting in step can be difficult.
Solution
By putting a matrix within another matrix or table, we are able to tame at least some of the variety / difficulty in formatting a SSRS report. This process also provides better control for displaying varying levels of aggregation on groups without having to create complicated row and column grouping with “inside” and “outside” rows or columns.
Embed a Matrix
The process of adding a matrix or table within another matrix requires several steps to get it correct. First, you need to define the detail matrix which will be embedded into the “outer” matrix.
To display data for our reports, we will use AdventureWorks 2012 SQL Server database. Once you download and install the SQL Server database, we will subsequently use the SSRS 2012 sample reports. These reports are a good basis to demonstrate the use of an embedded or nested matrix.
After downloading the SSRS sample reports, go ahead and open up the AdventureWorks Sample Reports 2012 solution. We will use the SalesRegion.rdl as the starting point for creating a new report. For this sequence of examples, we will remove the Customer Sales Totals map and Sales Totals for All Customers tablix; we will focus on using Store Sales in Each State matrix.

After deleting the other objects and stripping out some of the Adventure verbiage to help with clarity, we now have the below report which is quite basic.


However what happens if we want:
- to add a year breakout for the columns while keeping the three current columns, State, Store, Total Due within one column group
- to add a region for the rows, but again, keep the three columns together
- finally, add a Total Due for all Regions by Year under each of the above noted years and a Grand Total at the top.
We could potentially accomplish some of the grouping fairly easily, but we would not have the columns repeating as requested. The Total Due per year would also prove to be a bit tedious. To get around these issues, we are going to use the matrix within a matrix technique. To accomplish this task, we will first open up the Toolbox and then drag a new matrix onto our report grid. Next we will select the existing matrix (be sure you are selecting the entire matrix and not just one part of it) and then drag it into the data section of the new matrix as shown below. </p


Notice how the inner matrix is squeezed into the data text box of the “outer” matrix. We can easily make the “inner matrix” wider by increasing the column width of the outer matrix, as illustrated below. Similarly, we can increase the row height, also shown below, by dragging the row border down.


Now our inner matrix has a good area to show the header, footer, and detail rows and columns. Our next step is to add the column and row groups to the outer matrix. As shown next, the Order Year will be added as a column group and the Region aka Sales Territory Name as the row group.
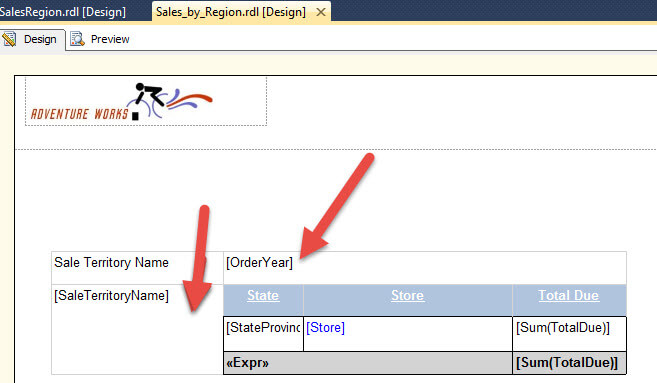
Finally, for this set of steps, we can finish by adding color to the background and font and centering the text within the row and column fields as displayed.

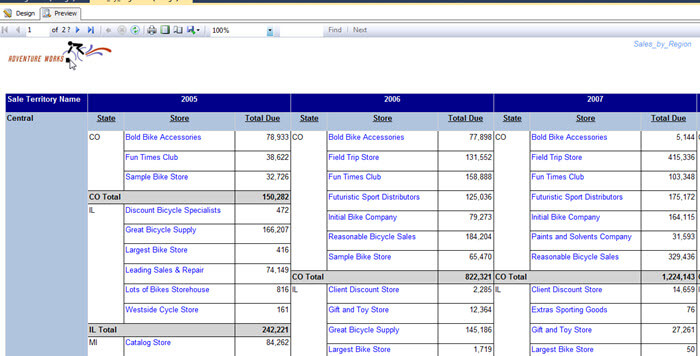
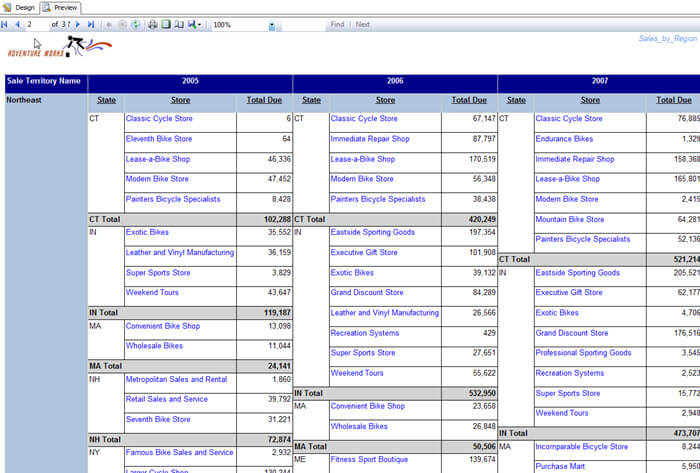
The next set of screen prints preview the first 2 pages of the report; we quickly see that we accomplished requirements 1 & 2 by displaying the three inner or nested matrix columns “together” for each outer matrix column and row.</p
Page 2
Finally, we need to add the Total Due for All Regions figure as mentioned in the initial requirements. We can accomplish this task by adding a row to the outer matrix above and “outside” the Region row group. By adding the Sum(TotalDue) entry here, as shown in the red background, we will get the total per year without all the other intermediate breakouts.

Last, we can add an Overall Total Row to the outer matrix as the top most row, as shown subsequently in the green background.

We now have a working matrix within a matrix report meeting our three requirements. Below, we display a preview of the final report.

Of course, as with any feature, a few caveats exists. First, the inner matrix data resides within the scope of the particular column and row group of the outer matrix. In our example, that means the entire inner matrix will reside inside each OrderYear column; likewise, the inner matrix resides fully within each region of the outer matrix. Secondly, the “Repeat header rows on each page” or “Repeat column headers on each page” options do not work for the inner matrix and will return an error if enabled (checked). Last the sizing of the matrix is only dynamic within each matrix; as such the outer column and row control the inner matrix display and do so proportionally.

Conclusion
The matrix within a matrix functionality provides a wonderful method of embedding a full matrix report within another matrix. In many instances, this functionality allows for easier display of detail groups and complicated or out of the ordinary group aggregates. The process allows you to create an inner matrix and then drag and drop that matrix into the data area of the outer matrix. Subsequently, you adjust the outer matrix to appropriately display the full inner matrix all while displaying any total needed for the outer matrix. I know this functionality seems very simplistic, but does require a good understanding of the scope used by both the inner and outer matrix. Finally, even with its simplicity, I have been told by many report designers that they did not know or realize that this functionality was available!
Next Steps
- Placing a chart within a matrix – https://www.mssqltips.com/sqlservertip/2757/ssrs-textbox-tips-and-tricks/
- Check out all of the SQL Server Business Intelligence Tips.

I have a passion for crafting Business Intelligence Solutions for my user groups. My experience includes almost 15 years of SQL Server involvement with the last 12 years focused specifically on Business Intelligence, SharePoint, OLAP, SSRS, and Decision Support solutions. Currently, I am a Business Intelligence Architect in the healthcare industry, and I also teach database and analytics classes for Kennesaw State University, Southern New Hampshire University, and Reinhardt University. My education includes an MBA and an undergraduate in Accounting (yes I am a reformed accountant!), both from Kennesaw State University. I enjoy every day by trying to grow my faith and spend precious time with my family. I have been happily married to my wife of over 20 years, and we have two teenagers one who we home school with the help of a University Model School, Cornerstone Prep in Acworth, GA (cornerstoneprep.org). Our other child is a Construction Management major at KSU’s Southern Poly / Marietta campus. We are a soccer and Cross Country (XC) family who play, coach, and referee soccer or run for fun most every day. For several years, our family has volunteered (and played with the dogs and cats) at Etowah Valley Humane Society in Cartersville, GA.
- MSSQLTips Awards: Champion (100+tips) – 2016 | Author of the Year – 2015 | Author Contender – 2014, 2016-2021