
Display Active Slicers in Power BI using Dynamic DAX
Learn how to enhance visibility using slicers in Power BI for better report filtering and user experience.
Power BI desktop edition for reporting and visualizations.
Learn how to enhance visibility using slicers in Power BI for better report filtering and user experience.

Solve the frustrating date spillage issue in Power BI. Discover techniques to prevent measures from spilling into future dates.

In this article, we look at how to get the Power BI download, install, and build a report in a step by step tutorial.

Discover the benefits of Power BI custom calendars and how they enhance time intelligence reporting with new DAX capabilities.

In this article, we look at different ways to structure the data and tables to help improve Power BI query performance.
In this article, we go over how to build a dynamic Power BI countdown timer visual to be added to your reports and dashboards.

In this article, we look at how Power BI connects to SQL Server using either DirectQuery or Import mode and when to use each.
Learn how to build a Power BI time dimension using Power Query to easily create report breakdowns by various time elements in Power BI.

This tip provides insights into common questions relating to Power BI Deployment Pipeline features and what you should know.

In this tip, we shed some light on the different roles of Power BI and Microsoft Fabric, and hopefully take away most of the confusion.

This tip discusses additional pitfalls to be aware of when working with Power BI.
Learn how users can do a SQL Export to Excel from tables in an Azure SQL database via Power Query without direct database access.

This tip explains Power BI best practices for workspace management, including archiving, and cleaning for an efficient Power BI environment.

This tip presents a list of frequently encountered Power BI pitfalls and some of the things you can do to have successful Power BI projects.

Learn about the four INFO.VIEW DAX functions: INFO.VIEW.COLUMNS(), INFO.VIEW.TABLES(), INFO.VIEW.RELATIONSHIPS(), and INFO.VIEW.MEASURES().

Fabric's Semantic Link Python package, SemPy, allows you to read and write data from Power BI using Python to generate documentation.

In this tip, we show how to create perspectives using Power BI Desktop and Tabular Editor to show only a selection of items to a user.

This article explains how to aggregate data for Power BI reports and provides examples of running totals, running averages, min, max, and more.
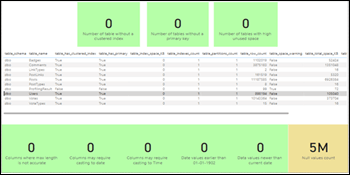
In this article, we look at how to use Power BI to help visualize and profile data in a database for data quality monitoring.
In this article, learn how to build a Power BI report from start to finish with a real-life example using COVID-related data.

Check out this structured reference guide to just about anything you want to know about Power BI and Power BI report development.
Learn how you can export millions of rows of data out of Power BI to either a CSV or Excel file.
In this article, learn how to set the current fiscal month identity in a calendar table using DAX for Power BI when dealing with fiscal periods.
Learn how to write logical expressions using DAX when working with Power BI with logical operators, functions, and more.