Problem
I would like to learn the DAX query language for SQL Server Analysis Services Tabular Data, is there a simple tutorial to get started?
Solution
In this tip, we will work with DAX for newbies who want to get started.
DAX means Data Analysis Expressions and it is a simpler query language than MDX. MDX or Multidimensional Data Expressions is the language used for the Analysis Services Multidimensional Databases. DAX started as a function language and an extension of Excel in Power Pivot. Now it is a query language used in Tabular Databases. Tabular Databases started in SQL Server 2008 R2 and now the functionality and popularity is increasing.
Requirements
- SQL Server 2012 or later with a Tabular Instance installed.
- The AdventureWorks Tabular solution installed.
Getting started
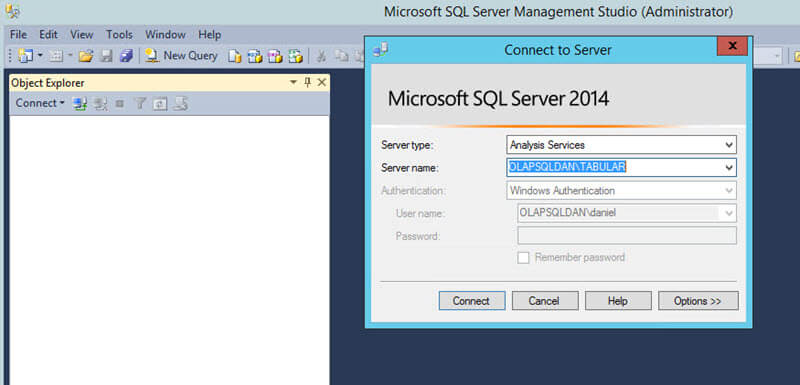
In order to start, open SSMS and Connect to a Tabular Server.
In SSMS, right click on the database, select New Query and MDX. Currently MDX is used to execute MDX and DAX queries.

DAX Evaluate
The most basic statement is the Evaluate, which is like a SELECT in T-SQL.
evaluate 'Currency'
The evaluate statement contains the table expression to show the results. In this example, Currency is the dimension contained in the Tabular Database. The result displayed by the DAX query is the following:

You can also use parenthesis with the Evaluate statement and obtain the same results of the statement as step 3.
evaluate
  (
   'Currency'
  )
In order to show the values of a single column, you can use Evaluate values and specify the table and the column. In this sample, the table (which is a dimension) is currency and the column is CurrencyKey.
evaluate(values('Currency'[CurrencyKey]))
The result displayed by the query is the following:

DAX Date Functions
To handle dates, you can use Now(), to show the current date and time. You also use the function Year(), to get the year of a specified date and you can also use Month(), Day(), Hour(), Minute() and Second() with a specified date.
evaluate(
ROW
(
"CurrentDate",Now(),
"Year",Year(Now()),
"Month",Month(Now()),
"Day",Day(Now()),
"Hour",Hour(Now()),
"Minute",Minute(Now()),
"Second",Second(Now())
)
)
The results displayed by the query are the following:

DAX Aggregate Functions
It is also possible to show the maximum, average, minimum, sum or count of rows using DAX. The following sample shows how to get the minimum, average, maximum, count of rows and sum of the CurrencyKey column.
 evaluate(
         row(
              "Minimum Value", min('Currency'[CurrencyKey]) ,
         "Average Value", average('Currency'[CurrencyKey]) ,
              "Maximum Value", max('Currency'[CurrencyKey]),
         "Count",count('Currency'[CurrencyKey]),
         "Sum",sum('Currency'[CurrencyKey])
           )
)
Here you have the results of the query:

DAX Filtering Queries
You can also add filters to your queries. The following sample shows the data of the Currency dimension where the CurrencyKey is equal to 5.
evaluate( filter('Currency', [CurrencyKey] = 5))
The result displayed by the query is the following:

DAX Ordering Data
You also specify the order in DAX to order the rows by one or more columns. Here is a sample of the Customer dimension ordered by the First Name and the Last Name.
evaluate ('Customer')
ORDER BY [First Name],
[Last Name]
The result displayed by the query is the following:

You can see above, the Customer First Name is Aaron, we can also start the query at another row as shown below.
DAX Start At Specific Record
The START AT helps you to show the data at a START column value. In this sample, the query will show the data starting at the First Name equal to Courtney.
evaluate ('Customer')
ORDER BY [First Name],
[Last Name]
START AT "Courtney"
The first name as you can see starts with Courtney with the new query:

Conclusions
In this chapter, we showed how to create simple queries using DAX. We used simple selects, aggregate functions and date functions. We also learned how to use filters and how to order the data. As you can see, DAX is not so very complicated and it is much simpler than MDX.
In future tips we will show more queries using DAX.
Next Steps
For more information about DAX, check this link:

Daniel Calbimonte is a Microsoft Most Valuable Professional, Microsoft Certified Trainer and Microsoft Certified IT Professional for SQL Server. He is an accomplished SSIS author, teacher at IT Academies and has over 10 years of experience as a QE and developer for SQL Server related software. He has worked for the government, oil companies, web sites, magazines and universities around the world. Daniel also regularly speaks at SQL Servers conferences and blogs.
- MSSQLTips Awards: Author of the Year Contender – 2015-2018, 2022, 2023 | Champion (100+ tips) – 2018
When running a DAX query against a Power BI XMLA endpoint I can get results in SSMS but right clicking the results pane gives me no option to export them or do other things I’d traditionally associate with the results pane. The only options are “Copy” and “Select All”. Is there a reason the results pane behaves so differently than running a standard SQL query? Is this expected?