Problem
At the time of writing, SQL Server 2016 preview CTP 2.4 has been released. A new feature of SQL Server Reporting Services (SSRS) 2016 introduced in this preview is the ability to customize the parameter prompt pane of a report. This tip will give an introduction to this new feature.
Solution
SQL Server 2016 preview
As mentioned earlier, at the moment of writing SQL Server 2016 is still in preview (currently CTP 2.4 has been released). This means that the look and feel of Reporting Services and its features can still change and that functionality might change, disappear or added.
Another issue is that the current release of SSDT-BI (the Visual Studio shell for developing business intelligence solutions) for SQL Server 2016 only supports Integration Services projects. You can develop BI solutions for SQL Server 2016 preview using SSDT-BI 2013 (which is actually for SQL Server 2014), but it has only SQL Server 2014 features. So how are we going to test new SSRS functionality? Luckily Report Builder has already been updated and included in the SQL Server 2016 CTP 2.4 release, so in this tip we’ll use Report Builder to test the new parameter pane.
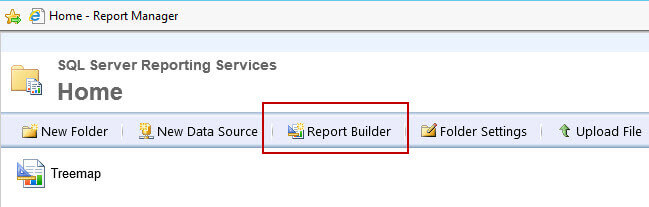
In order to use Report Builder, you need to install SSRS 2016 CTP 2.4 (or later), preferably not on your production machine. Then you navigate to Report Manager – typically the URL has the format http://myserver//Reports – where you can launch Report Builder.
The New Parameter Pane
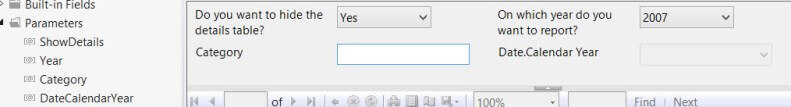
In previous versions of Reporting Services, you had no control over how the parameter pane looked like. Parameters were shown in the order in which the parameter were defined and that’s the only influence you could have. The old set-up looked like this:
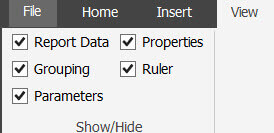
With the new parameter pane, you get a grid where you can add and place parameters where you want. But first you have to enable this grid. You can do this by selecting Parameters in the View tab of the ribbon.
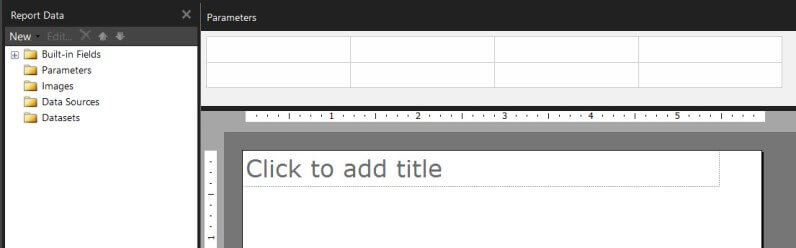
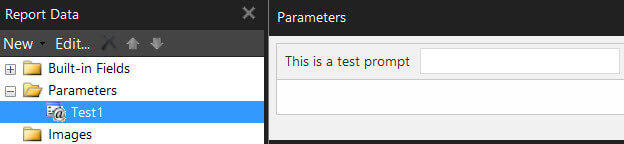
The parameter grid will be added to the top of the report canvas.
Adding Parameters
You now have multiple options to add a parameter to a report. You can do it as in previous versions, by right-clicking the parameters folder in the Report Data pane.
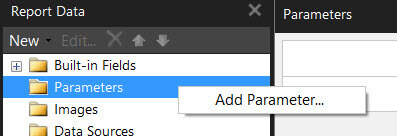
The new parameter will automatically be added to the grid.
You can also add a new parameter by right-clicking any cell in the parameter grid.
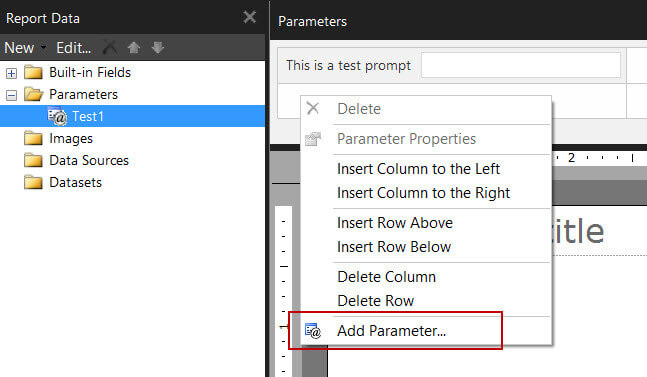
The new parameter will be added to the parameters folder as well. The last option is to add a parameter in a data set query.
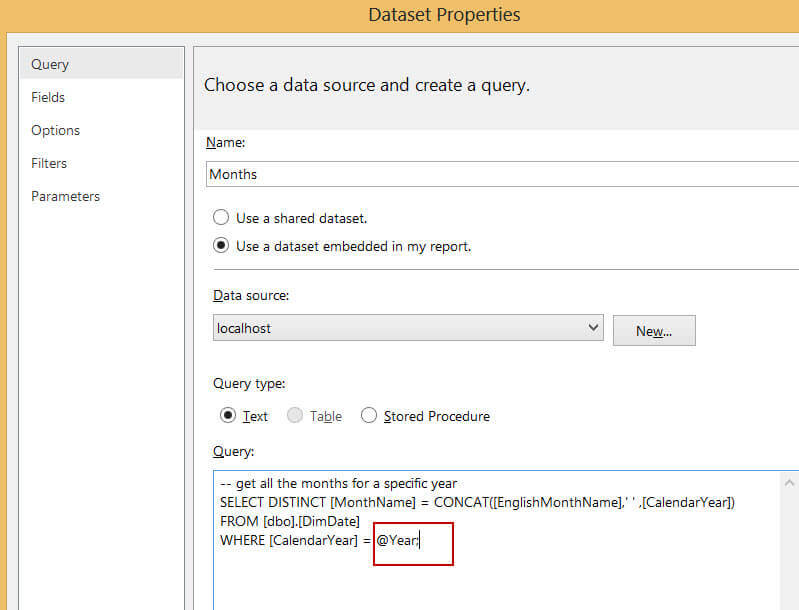
The parameter will automatically be added to the parameters folder, but not to the grid.
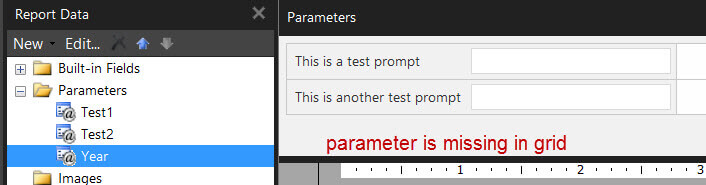
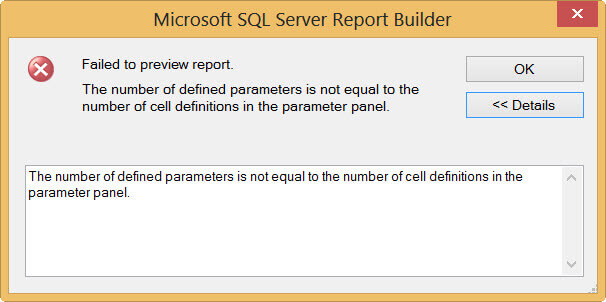
When you run the report, you receive an error explaining there is a mismatch between the parameter panel and the number of parameters.
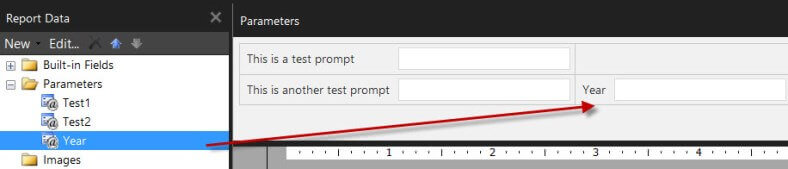
This might be an issue in the current release and be fixed in another release. For the moment, you can solve the error by dragging the missing parameter from the folder to the grid.
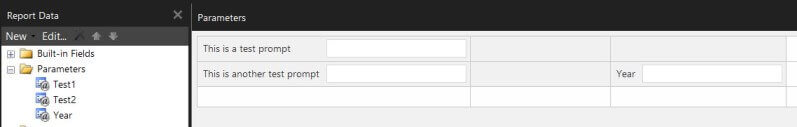
When parameters are automatically added to the grid, they are added to the top left corner of the grid when it is empty. If not, the new parameter is added to the right of the parameter on the most bottom right position. An example:
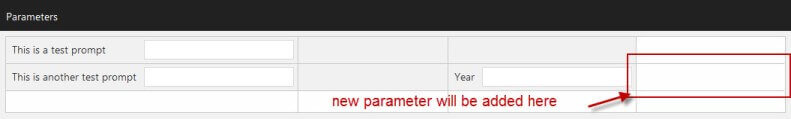
If there is no place left to the right, the parameter will be added to a new row.
Customizing the Parameter Pane
As in any table-like structure, you can add new columns and rows or remove them.
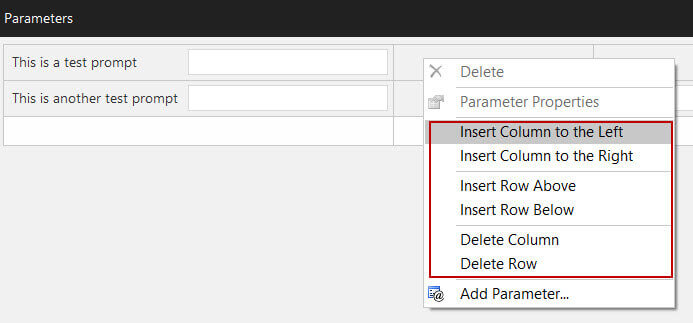
At the moment, there seems to be a maximum of 8 columns, but the number of rows appears not to have a limit. In the grid, you can move parameters to any position by dragging them to the desired cell. If there is already a parameter in that cell, the parameters swap positions. Keep in mind that changing the position of a parameter might impact the order of the parameter list.
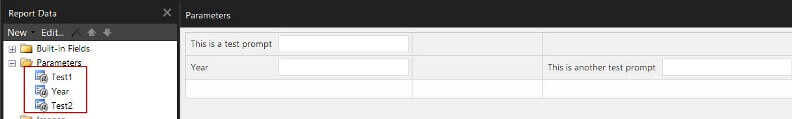
Let’s illustrate with an example.
When we switch the parameters on the grid, we can see the ordering has also changed.
Some other observations:
- In the grid, the cells with a grey background are the ones that will be displayed when the report is displayed.
- Removing a row or column will also delete all associated parameters on that specific row or column.
- For the moment it’s not possible to insert other objects in the grid such as text or images. It’s not clear if this will change.
Conclusion
The new parameter pane in Reporting Services 2016 is a step in the right direction for customization of how parameters prompts are displayed in reports. However, the options are quite limited: you can only change location in the grid.
Next Steps
- You can read the official documentation of this new feature here.
- For more information about SSRS 2016: What’s New in Reporting Services.
- For more SQL Server 2016, read these other SQL Server 2016 Tips.
- For more Reporting Services tips: Reporting Services Charts Tips.

Koen Verbeeck is a seasoned business intelligence consultant with over a decade of experience with the Microsoft Data Platform. He holds several certifications, including Azure Data Engineer. He’s a prolific writer, with over 375 articles on technologies such as Microsoft Fabric, SSIS, ADF, SSAS, SSRS, MDS, Power BI, Snowflake and Azure services. He has spoken at various events such as PASS, SQLBits, dataMinds Connect and many others. He frequently delivers educational webinars on MSSQLTips.com. For his efforts, Koen has been awarded the Microsoft MVP data platform award for many years.
- MSSQLTips Awards:
- Leadership Award (200+ Tips) – 2021
- Author of the Year – 2014/2020/2022
- Author Contender – 2024/2025