Problem
The Power BI team announced its support to create R visuals in its recent update and in this tip we’ll help you get started by walking through what R is, how you can configure Power BI Desktop to run R scripts and create R visuals in Power BI desktop.
Solution
If you are new to Power BI Desktop you can follow this tip by Scott Murray to help you get started with Power BI desktop.
What is R?
R is an open source and powerful statistical programming language used by statisticians, data scientists and researchers for data mining and data analysis. R scripts can be written using an IDE (Integrated Development Environment) like RStudio, Revolution-R and Live-R. If you are new to R, you can draw the following analogy of R to SQL queries for its application in Power BI Desktop. Like how a BI Developer creates queries in SSMS and uses it in a reporting environment such as SSRS, with this update we can use R scripts created in RStudio and use Power BI Desktop to create R visuals which will generate the same R visuals if they were to be created in RStudio.
Configuring R in Power BI Desktop
The R implementation is not natively supported in Power BI Desktop and you have to configure your machine to work with R.
You can download and Install R from Revolution Analytics or from CRAN repository. R installation is straight forward like how you install any software, once installed you will see R in your Program Files.
Let see how to link the installed R to your Power BI Desktop. Open your Power BI Desktop and navigate to its File Menu on the top left corner, in the file menu Click Options and Settings and open the Options from the tab popped up.

It will open the options window, Navigate to the preview Features tab and check the “Use an R script to plot a visual in the canvas” option to enable and create R visuals in the report canvas (this is a blank white report designer where you create visuals).

Power BI needs to have access to the R installed to execute R scripts, so go to the R Scripting tab in the same window and type in the drive location of where you have installed R in your machine, by default it gets installed in your Program Files.

Now, click the OK button – it will prompt you to restart your Power BI Desktop application to enable the configurations we have made.

Make sure to click the OK button and restart the application. After you restart – you will now see a new visual ‘R’ added in the Visualizations section like below.

We have now configured Power BI Desktop to create R visuals.
Creating R visual in Power BI Desktop
For this demo, I would like to use the regular season games played by an American NFL Football team the Baltimore Ravens and the data is provided by the Pro football website. I have the dataset downloaded and formatted as a CSV file and our first step in this process is to load the dataset.
Go to your Power BI Desktop application and click the drop down available in the Get Data option and select the CSV type.

It will open up a window browser. Navigate to our downloaded dataset and click Open.
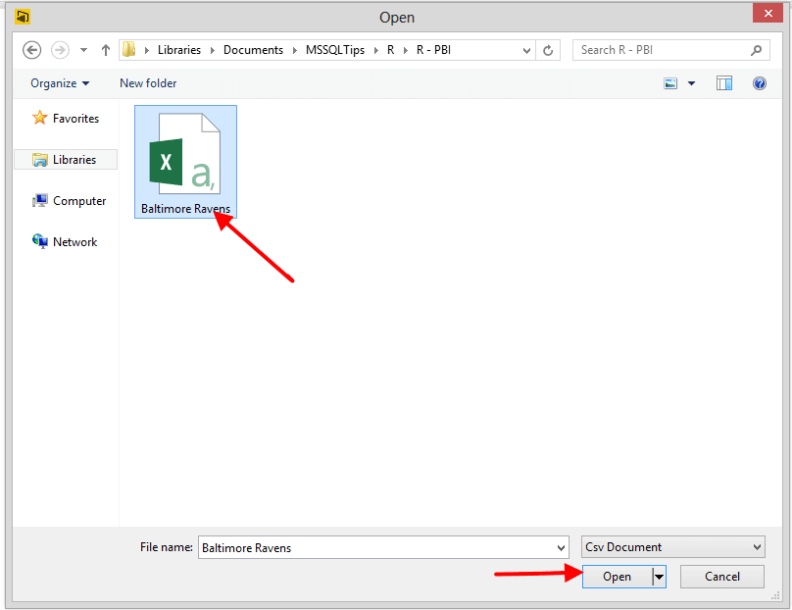
It will show you the preview option of the data available in the CSV file, click the Load button to load the data into Power BI Desktop.

Once the data is loaded you will see the fields of the dataset available in the Fields section of the Report Canvas.

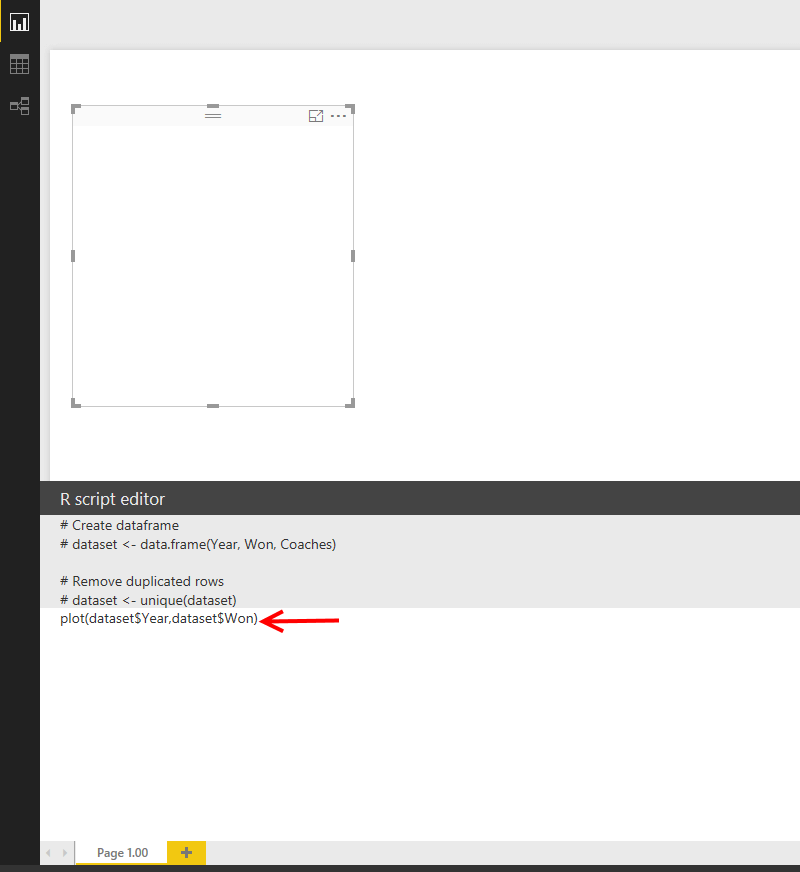
Double click the R visual in the Visualizations section, it will open an empty chart area and R-Script editor like below in the report canvas.

In my R visual, I want to see the number of games won by the Baltimore Ravens from 1996. I will drag the Year, Won and Coaches fields from the Fields section and drop it to Values.

Once you dropped the three fields into the values section you will see some R Scripts created automatically in the R Script Editor pane.
It creates a dataframe object in R from the fields we selected (Year, Won and Coaches) and removes any duplicates from the loaded data and creates a unique dataset (kind of automatic data cleansing by R). Dataframe is an object in R and can be considered equivalent to a table in the database world. This dataframe is assigned a name as dataset.
Let’s write a simple R script to plot the data. We will start with the plot() function available in R. Plot() function uses the arguments passed in it as X,Y and creates a scatter plot.
We will type the below code in the R Script editor:
plot(dataset$Year,dataset$Won)
This command references the dataframe – “dataset” created earlier and creates a scatter plot in R with Year in X axis and Won in Y axis.
Click the Run button in the R Script Editor pane you will see a scatter plot created in the report canvas.

Expand the R visual to maximize the scatter plot you should have an R scatter plot like below. As you can see, 2015 was a bad season for the Baltimore Ravens and they won only 5 games.

So far we have created our first R visual, let’s take our R learning to the next level by using one more R command. We will create a boxplot in R using the boxplot() command available in R.
Copy the below command into the R Script Editor and click the Run Button.
boxplot(Won~Coaches,data=dataset)
This command tells R to use the dataframe dataset to create a boxplot from fields – Won and Coaches and it will create a box plot like below.

This box plot created is vertically aligned and you can create a horizontal one by adding horizontal=TRUE to the boxplot command and running the script by clicking the Run button.
boxplot(Won~Coaches,data=dataset,horizontal=TRUE)
You will see a horizontal plot created like below.

Minimize the R script editor pane by clicking the Minimize button, expand the boxplot visual area to fit into the report canvas, rerun the script and you will see a nice R visual created like below.

In this tip we have learned how to configure Power BI desktop to use R and we created two R visuals in the Power BI platform.
Note: Currently this feature is available only in the preview version and you may not be able to deploy it to the Power BI service and it only supports the dataframe object in R.
Next Steps
- Download R and configure R to work with Power BI Desktop and explore the R visuals yourself.
- Create a histogram in R using the histogram() command.
- Explore how to use R in SQL Server 2016 by following this series by Koen Verbeeck

Junaith Haja is a senior data engineering leader with over a decade of experience transforming raw data into scalable platforms and actionable insights that drive business performance, operational excellence, and sustainability. At Amazon, he applies a “data as a product” philosophy to architect resilient data infrastructures supporting global domains such as identity verification and financial risk mitigation.
Beyond engineering execution, Junaith is an active voice in the global data and AI ecosystem. He has authored over 100+ articles in major database and AI platforms including MSSQLTips.com, AITimeJournal, AI Frontier Network, DZone. He writes a weekly LinkedIn newsletter, Signal Over Noise and his personal blog juniathhaja.com where he shares insights on data engineering, AI and leadership. He serves as a Senior Member of IEEE, a Fellow at the Institute of Analytics, and a Distinguished Fellow at the Soft Computing Research Society, reinforcing his commitment to responsible, sustainable, and impactful data practices.