Problem
What are the steps to create a SQL Server Reporting Services (SSRS) Report from an Analysis Services Tabular Database?
Solution
In this tip, we will show how to create reports using SQL Server Reporting Services (SSRS) from a Analysis Services Tabular Databases including charts and data set filters.
Requirements
- SQL Server 2014
- A Tabular Database installed
- SSRS installed
- SQL Server Data Tools Installed (SSDT)
- The Adventureworks DW Tabular Model
SSRS Report from a Tabular Database
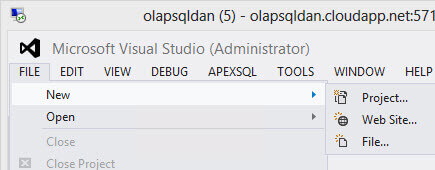
- Open SSDT.
- Go to File > New > Project:
- Select the Report Server Project Wizard:

- The welcome message will be displayed:

- The Data Source will contain the connection information. In the type, select the Microsoft SQL Server Analysis Services. This type is used for Multidimensional and Tabular models. Press the edit button:

- Specify the instance name and select the database name. In this example, we will use the local instance named Tabular and the Semantic database which is the Adventureworks database for Tabular databases:

- Once that the connection string is configured, in the Select the Data Source, press next:

- In the Design the Query interface, press Query Builder to create a query (you can also create your query manually, but it requires MDX skills):

- Go to Measures > Internet Total Sales and drag and drop the value to the report pane:

- In the Geography dimension, drag and drop the country region name to the report. The result is the Total Sales per country:
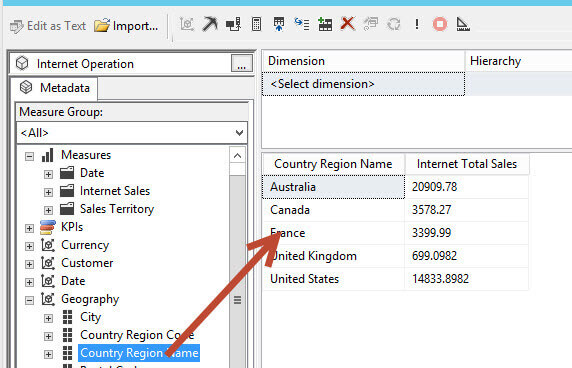
- As you can see, the query created is in MDX for the Tabular Database. If you are not familiar with MDX, we recommend you to read our article about MDX. The MDX query is showing the non empty fields of the Internet Total Sales Measure per Country Region Name. It means the Total Sales per country:

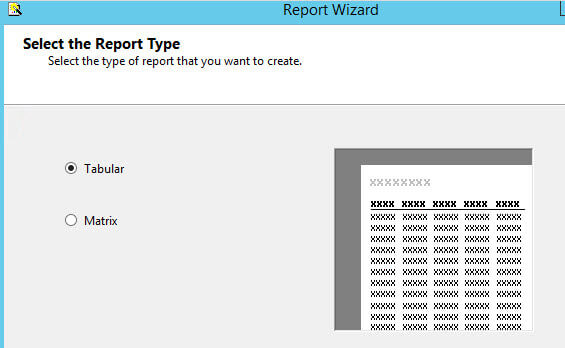
- The next option allows you to select the type of report. Tabular is the traditional report while in the matrix type you can select which attribute is row and which column:
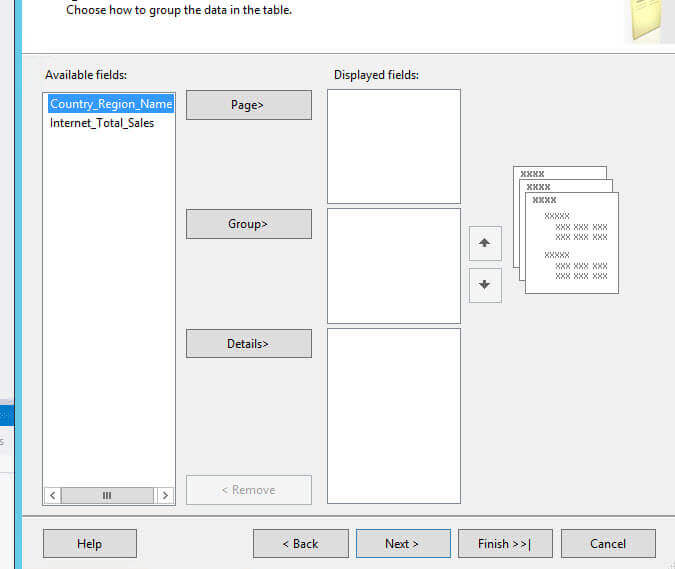
- In the grouping window, keep the default values and press the Next button:
- Choose the Table Style of your preference:

- Select the Report version. By default, it is SQL Server 2008 R2 or later. You can specify the URL and the name of the folder:

- Specify the report name and check the preview report option:

- Your report can be exported to XML, CSV, TIFF, PDF, MHTML, Excel and Word:

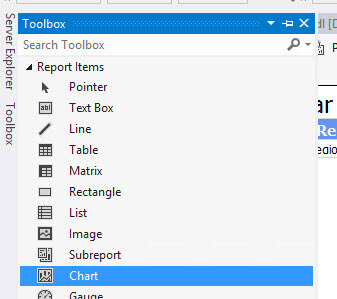
- To create a chart, in the Toolbox drag and drop the chart item:
- Select the first chart type:

- Drag and drop the Country Region Name and the Internet Total Sales in the graph:

- You will have a graph similar to the following:

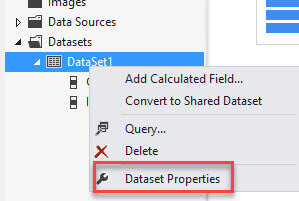
- If you want to modify the query you can do so by right clicking on the Datasets and select Dataset Properties:
- You can modify the query by pressing the fx button:

- You can also add filters at the dataset level. The following filter excludes France from the list of countries in the report. This filter is not efficient because all the data is retrieved from the query and the filter is applied later. We will talk about filters at the query level in future tips:

Conclusion
In this tip we demonstrated how to create reports using the SSRS wizard with a Tabular Database. We also learned how to create charts and how to filter data at the Dataset Level. As you can see, creating reports with a Tabular Database is a straightforward process and it does not require advanced skills in Tabular Databases. We used the Wizard to start, but once you are familiar with the reports it is a good practice to manually customize your reports using shared data sources, data sets, parameters and SSRS expressions.
Next Steps
For more information about SSRS, refer to these links:

Daniel Calbimonte is a Microsoft Most Valuable Professional, Microsoft Certified Trainer and Microsoft Certified IT Professional for SQL Server. He is an accomplished SSIS author, teacher at IT Academies and has over 10 years of experience as a QE and developer for SQL Server related software. He has worked for the government, oil companies, web sites, magazines and universities around the world. Daniel also regularly speaks at SQL Servers conferences and blogs.
- MSSQLTips Awards: Author of the Year Contender – 2015-2018, 2022, 2023 | Champion (100+ tips) – 2018