By: Rick Dobson | Comments | Related: > Reporting Services Development
Problem
My organization maintains some critical business information in a database on an Oracle 11g server. However, we also have a community of report developers and business analysts who are familiar with generating charts and reports via SQL Server Reporting Services (SSRS) running with SQL Server 2014. Please provide an example of an easy way to generate charts and reports with SSRS for our data in Oracle 11g.
Solution
SSRS does not connect directly to Oracle 11g databases, but you can readily create a linked server from a 64-bit SQL Server, such as 2014, to the 64-bit Oracle 11g database server. A linked server can be used to retrieve data directly from an Oracle 11g server. Navigate to this URL for detailed instructions on setting up and configuring the linked server. View this other tip for step-by-step instructions on migrating data both ways between SQL Server 2014 and Oracle 11g. Once the data is retrieved from Oracle 11g, you can perform any required processing and then prepare charts and reports with SSRS for data retrieved from Oracle to SQL Server.
To demonstrate the approach in this tip, all steps from populating an Oracle table to retrieving the data to SQL Server, through to generating an SSRS matrix report with a sparkline chart are described. In a practical application, you will typically not have to populate a table in an Oracle database from SQL Server because you would not be using this tip if the data were already in SQL Server.
Overview of Process
The tip uses a linked server to an Oracle 11g database to retrieve data to a SQL Server 2014 database. Then, the retrieved data are manipulated for a report. The report shows monthly changes in S&P 500 index prices as well as daily price changes within months across years. The overall monthly change is displayed as a number and the daily price changes are displayed as points in a sparkline chart. The source data for this tip originates from the Yahoo Finance website.
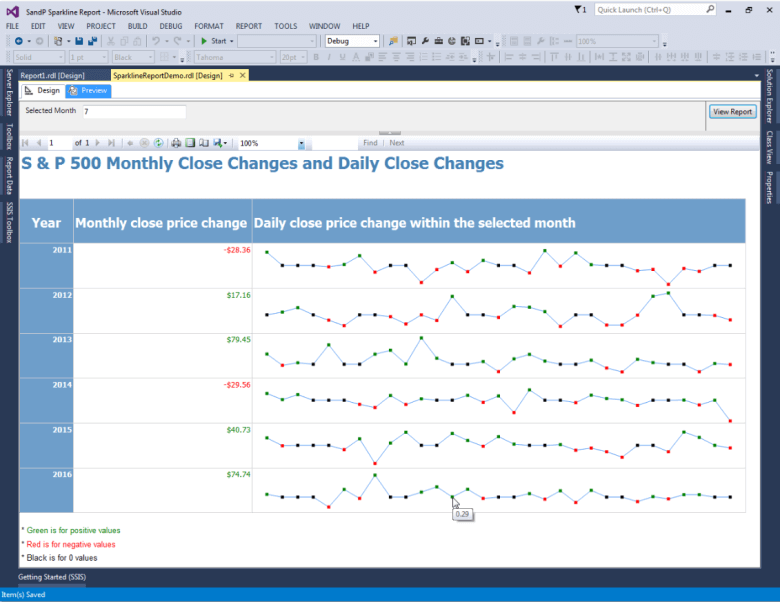
Users can pick a month for which they want the report to display results. The following screen shot displays July 2016 S&P 500 data. The report includes three columns for year, monthly change in price during a selected month, and daily price change within a selected month. Both monthly and daily price changes are dynamically color coded - red for negative change, green for positive change, and black for no change. Additionally, users can display the numeric value for a daily price change via a tooltip. For example, the following report shows a change of .29 for July 13 in 2016 (the thirteenth point on the sparkline for 2016 row).
Downloading S&P historical prices to your computer
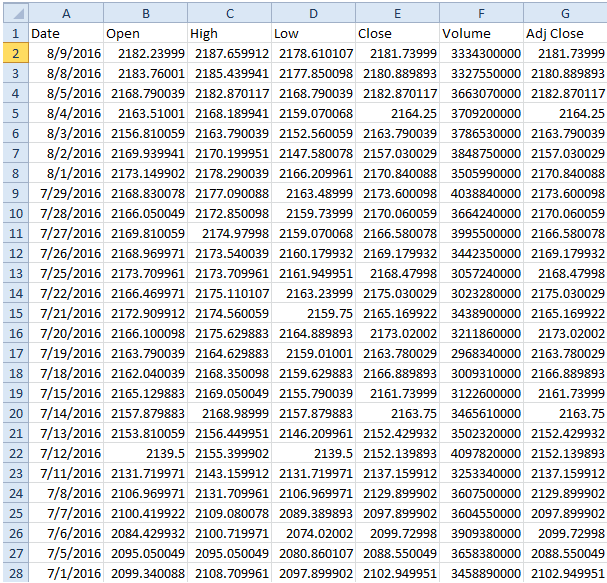
The source data used for this tip are historical S&P 500 high-low-open-close-volume data from the Yahoo Finance website. Direct your browser to http://ichart.finance.yahoo.com/table.csv?s=^GSPC&ignore=.csv to download the historical data to a csv file on your computer.
Below is an excerpt from a file downloaded on August 10, 2016. Notice that the data start from the day before the download (August 9, 2016). Each row has a date along with associated data, such as the closing price for the day (Close). The URL returned data going back to January 3, 1950, but the excerpt just shows data back through the beginning of July 2016.
Notice also that not all dates in a month have rows with data. July 2 through July 4 in 2016 do not have rows. The stock market was closed on these dates. July 4 was a holiday, and July 2 and 3 were weekend days when the market is also closed.
Architecture of the SSRS Sparkline Report Tip
After downloading the historical prices from the Yahoo Finance website to a csv file on your computer, there are five remaining data processing steps to configuring the data for this tip. These steps are implemented from an SQL Server Integration Services (SSIS) package named SandPHistoricalPrices.dtsx that resides within the SandPHistoricalPrices SSIS project. You can run the package in the SSIS project to prepare a table referenced by a SSRS project that generates the matrix report with the sparkline chart. The name of the SSRS project is SandP Sparkline Report.
The following screen shot shows a control flow view of the five key data processing steps from within the SandPHistoricalPrices SSIS project.
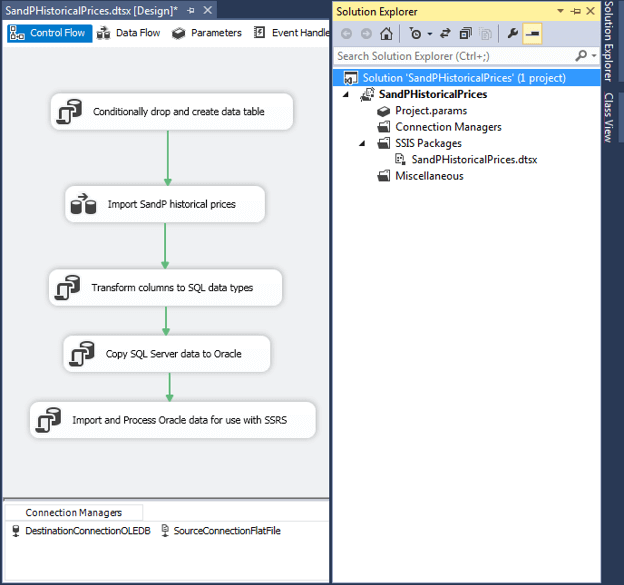
Here's a brief synopsis of each step. All the steps, except one, are SQL task steps. The Import SandP historical prices step is the lone data flow task step.
- Conditionally drop and create data table: This step creates a fresh copy of the SandPHistoricalPrices table which is used for storing downloaded S&P historical data from the Yahoo Finance website
- Import SandP historical prices step: This step imports the downloaded historical prices from a csv file to a SQL Server table; review this MSSQLTips.com tip and the SandPHistoricalPrices SSIS project for additional help on accomplishing this and the next step
- Transform columns to SQL data types: This step transforms the character data from the imported csv file to SQL Server data types, such as datetime type instead of a character representation of Date column values
- Copy SQL Server data to Oracle: This step uses a linked server to create a target table in Oracle and then insert data from a SQL Server table with historical prices to an Oracle table
- Import and Process Oracle data for use with SSRS: This step retrieves data from the Oracle data with historical prices and performs preliminary processing for making the data ready for a matrix report with a sparkline chart
The SourceConnectionFlatFile connection manager references the csv file with historical prices. The DestinationConnectionOLEDB connection manager references the SQL Server and database storing tables to support the SSRS report. For this tip, the database name within SQL Server is set to SandP_sparkline_tip.
Code for Copy SQL Server data to Oracle
The T-SQL code for the step that copies S&P 500 historical prices from SQL Server to Oracle appears below. There are three parts of the script.
First, the code invokes an EXEC statement to drop a table in Oracle through the OrclDB linked server. This linked server points to the HR schema of the sample database that installs with Oracle 11g. The DROP TABLE operates under the permissions for the HR user, which must have permission to drop a table in the HR schema within the Oracle database. This tip uses the same linked server established in the prior tip. If the SandPPricesConverted table does not exist in the Oracle database, the command cannot be executed in Oracle, but this does not cause an error in SQL Server.
After ensuring that the SandPPricesConverted table does not already exist in the Oracle database, the code invokes another EXEC statement to create a new table named SandPPricesConverted. This statement indicates some field conversion conventions that you may find useful in your own custom conversion development work between SQL Server and Oracle. For example, consider using:
- The Oracle Date data type to receive SQL Server datetime values
- The Oracle Number data type with 10 and 4 scale factors to receive SQL Server money values
- The Oracle Number data type without scale factors to receive SQL Server bigint values
Third, the code does a bulk insert into the SandPPricesConverted table within the Oracle database from the SandPHistoricalPrices_converted table in SQL Server, which is created and populated by the third control flow step.
-- CREATE table in ORACLE

-- Drop Oracle table if it already exists
EXEC ('DROP TABLE SandPPricesConverted') at OrclDB

-- Create Oracle table for holding data exported
-- from SQL Server
EXEC  (
'
CREATE TABLE SandPPricesConverted
(
         spDate Date NULL,
  Open Number(10,4),
  High Number(10,4),
  Low Number(10,4),
  Close Number(10,4),
  Volume Number
)'
)
at OrclDB


-- Insert data into Oracle table
-- from SQL Server table
INSERT INTO OrclDB..HR.SANDPPRICESCONVERTED
SELECT
       [Date]
      ,[Open]
      ,[High]
      ,[Low]
      ,[Close]
      ,[Volume]
  FROM [dbo].[SandPHistoricalPrices_converted]
Code for Import and Process Oracle Data for use with SSRS
The code for importing and processing the Oracle data with SSRS will typically be the most custom part of an SSRS application. This is because the actual data which shows in a SSRS report depends on the precise needs of the client for a report. For this tip, the report specification is to process Close price changes relative to the previous trading day for data from 2011 through 2016. Additionally, the chart should include dates whether or not they are for trading dates. Therefore, weekends and holiday dates should appear on the chart.
As noted in the section on downloading S&P historical prices to your computer, the source data only has dates for trading days. Therefore, we need another table with dates for trading days as well as weekends and holiday dates that extend at least over the range of source data. The following script is an example of one way to create and populate such a table. The name of the table is stock_date. This table is used in the code for the fifth data processing step.
-- create stock_date for S&P date
USE SandP_sparkline_tip
GO


IF EXISTS
(
SELECT *
FROM INFORMATION_SCHEMA.TABLES
WHERE TABLE_NAME = 'stock_date' AND TABLE_SCHEMA = 'dbo'
)
DROP TABLE dbo.stock_date;


CREATE TABLE stock_date
(
stock_date date
)

DECLARE
@day_step as int = 1
,@today date = '1/1/1950'

WHILE @today <= '12/31/2016'
BEGIN
INSERT INTO stock_date values(@today)
SELECT @today= DATEADD(dd,1,@today)
END
The code importing and processing the data from Oracle creates a new table in SQL Server (SandPforSparkline) with the processed data from the SANDPPRICESCONVERTED table in Oracle and the stock_date table in SQL Server. When using a linked server to retrieve data from Oracle, table names and schema names must appear in caps. The SandPforSparkline table in SQL Server has just two columns:
- stock_date from the stock_date table which has all calendar days and not just trading days
- change (or delta) from yesterday for close price for the S&P 500
Most of the work for the fifth processing step occurs within a nested query. This nested query implements a left outer join between the SQL Server stock_date table and the Oracle SANDPPRICESCONVERTED table. Another key feature of the nested query is a CASE..END statement with a LAG function that is used to compute the change in close price from the previous trading day ([Delta for Close from Yesterday]). The CASE..END returns a value of 0 for [Delta for Close from Yesterday] when spdate is NULL; these NULL values and their corresponding 0 value for [Delta for Close from Yesterday] are for calendar days in which there is no stock market trading, such as holidays and weekends.
The outside query filters its result set to return data just for dates with year values from 2011 through 2016. The combination of the outer query with its inner query is one way to ensure that the first date in the [Delta for Close from Yesterday] column is defined as a numeric value instead of a NULL value.
-- Populate dbo.SandPforSparkline in SandP_sparkline_tip db
-- based on data from Oracle (HR.SANDPPRICESCONVERTED)
-- accessed via a linked server (OrclDB)

DECLARE @SelectedMonth int


-- conditionally drop SandPforSparkline table
IF EXISTS
(
SELECT *
FROM INFORMATION_SCHEMA.TABLES
WHERE TABLE_NAME = 'SandPforSparkline' AND TABLE_SCHEMA = 'dbo'
)
DROP TABLE dbo.SandPforSparkline;


-- Compute stock_date and [Delta for Close from Yesterday] columns over date
-- range required by the SSRS chart
SELECT
 stock_date
,SUM([Delta for Close from Yesterday]) AS [Delta for Close from Yesterday]
INTO dbo.SandPforSparkline
FROM
(
SELECT
stock_date
,[CLOSE] [Close]
,CASE
 WHEN SPDATE IS NOT NULL
  THEN (([Close]-LAG([Close],1) OVER (ORDER BY [SPDATE])))
 ELSE 0
 END AS [Delta for Close from Yesterday]

FROM [dbo].stock_date
 LEFT OUTER JOIN  OrclDB..HR.SANDPPRICESCONVERTED
  ON stock_date.stock_date = SANDPPRICESCONVERTED.SPDATE
) for_chart_data
WHERE YEAR(stock_date) IN (2016, 2015, 2014, 2013, 2012, 2011)
GROUP BY stock_date
Configuring the Data Source and Dataset properties for the report
After configuring the source data table for a report, you can use the SSRS new report wizard. This wizard allows you to specify a data source and dataset for the new report. The demonstration presented here uses a shared data source for the report.
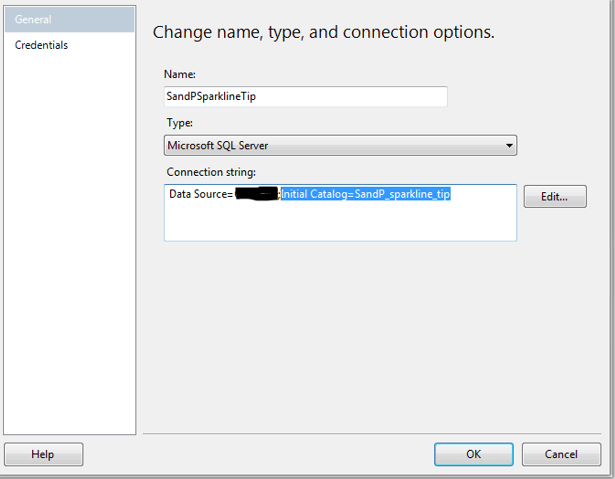
The Data Source property of a new report can be specified based on the SQL Server name and database name within the server. The server name will be the name of the server on which you create the database for the application.
The database name for the sample tip is SandP_sparkline_tip; this name appears in the connection string. The name for the shared Data Source is SandPSparklineTip.
The dataset query includes a parameter (@SelectedMonth) that lets the user specify a selected month at run time for the report. Here's the sql code for the dataset query. The SUM function does not aggregate any results. Instead, it just allows the inclusion of the [Delta for Close from Yesterday] field without requiring it to be part of the GROUP BY clause.
SELECT
  YEAR(stock_date) AS [S&P YEAR]
 ,DAY(stock_date) AS [S&P DAY]
 ,SUM([Delta for Close from Yesterday]) AS [Delta for Close from Yesterday]
FROM SandPforSparkline
WHERE (YEAR(stock_date) IN (2016, 2015, 2014, 2013, 2012, 2011)) AND (MONTH(stock_date) = @SelectedMonth)
GROUP BY YEAR(stock_date), DAY(stock_date)
Three fields in the dataset query statement are renamed by SSRS to follow its field naming rules. When referencing these fields in the report specification, you need to designate them by their SSRS name. The new names for the three fields appear below:
- [S&P YEAR] becomes S_P_YEAR
- [S&P DAY] becomes S_P_DAY
- [Delta for Close from Yesterday] becomes Delta_for_Close_from_Yesterday
Specifying the report's rows and columns
After specifying the data source and dataset for a new report as indicated above, you need to specify the layout of data in the report.
- Start by choosing a Matrix report type
- Then, assign fields to matrix properties as follows: S_P_DAY to Columns, S_P_YEAR to Rows, and Delta_for_Close_from_Yesterday for Details
- Unless you have special formatting requirements, Exit the Report Wizard by clicking Finish twice
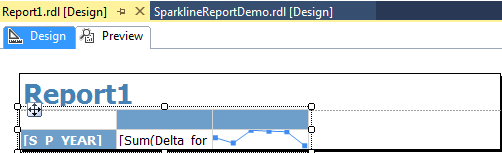
- In Design view, right-click in [S_P_DAY] column header and choose Insert Column --> Outside Group Left to add a new column
- Designate the contents in the text box for the new column by right-clicking the blank text box for the new column and choosing Text Box Properties
- Then, click the fx button for Value and use the Expression Wizard to enter: =Sum(Fields!Delta_for_Close_from_Yesterday.Value)
- Insert a new column to the right of the column with the summed daily change in close values throughout a month within a year
- Right-click the text box in the new inserted column and choose Insert --> Sparkline; then, select the Line with Markers sparkline type
- Double-click the sparkline image and click the + sign for Values; then select: Delta_for_Close_from_Yesterday
- Delete the column to the right of the one with the sparkline chart
At this point, the Design view of your report will look something like Report 1 in the following screen shot. The screen shot shows the tablix portion of the report with a handle used to move it so that the tentative report title (Report 1) is not obscured by the report's body. Manually manipulate the report elements so that the layout is similar to the screen shots in the next section. By the time you get your report arranged so that its Design view is similar to the one in the next section, you will be ready to add dynamic color assignment and tool tips.
Because of the many manual tweaks that can make such a big difference in SSRS reports, I recommend that you view several video presentations on SSRS sparkline reports. Here are links to a couple that you might want to start reviewing resource 1 and resource 2.
Configuring color coding for the report
One of the features of the report is that it implements dynamic color assignments for values in the Monthly close price change column and the data markers in the sparkline chart.
Notice from the following Design view of the report that the monthly close price change values appear in a text box. This text box has properties that govern, among other features, the color for the font showing monthly close prices. Recall that the color can be red (for negative values), green (for positive values), or black (black for no change). The following expression for the color property of the font for the text box implements dynamic color assignments according to the specification.
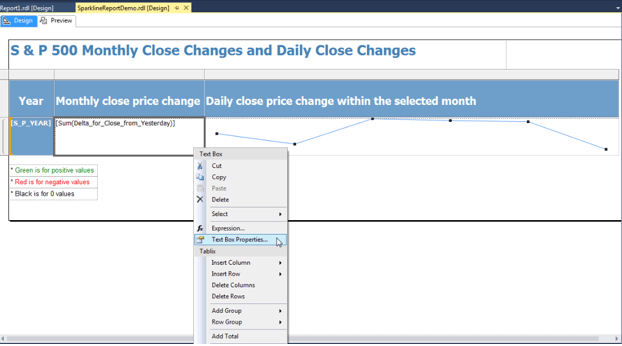
The expression includes nested IIF functions.
- The outer function assigns a black color font if the sum of the daily changes for the selected month is 0
- The inner function assigns a red color font if the sum is less than 0 and a color font of green if the sum is greater than 0
=IIF(Sum(Fields!Delta_for_Close_from_Yesterday.Value) = 0,"Black",IIF(Sum(Fields!Delta_for_Close_from_Yesterday.Value) < 0, "Red", "Green"))
Color coding for the sparkline markers is implemented from the Series properties of the sparkline chart (see properties selection below). Selecting the Series properties exposes sparkline Markers which have a color property. The daily close price changes are for individual days, and these changes do not require a Sum function. Instead, the daily close price changes depend on individual Delta_for_Close_from_Yesterday values. Otherwise, the expression for dynamic color assignment is the same as for the text box displaying monthly close price changes.
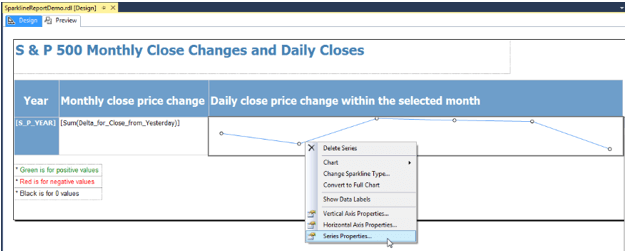
=IIF(Fields!Delta_for_Close_from_Yesterday.Value = 0,"Black",IIF(Fields!Delta_for_Close_from_Yesterday.Value < 0, "Red", "Green"))
Configure ToolTips for Sparkline Data Markers
You can add ToolTips to sparkline chart markers by selecting the Series Properties for the chart. This time, choose Series Data within the Series Properties dialog box. Then, click the fx button for the ToolTip property. Finish the chart by using the Expression Wizard to enter the following expression. The expression rounds the series values from up to 4 places after the decimal point to just 2 places after the decimal point. This transformation is required because money data type values can have 4 places after the decimal point. Entering any expression in the ToolTip property enables a report user to display the value corresponding to a point by hovering the cursor over a series point on a chart.
=ROUND(Fields!Delta_for_Close_from_Yesterday.Value,2)
Next Steps
The main point to take away from this tip is that it is easy to leverage SSRS report development expertise with data that originates in an Oracle 11g database. While SSRS does not natively connect to Oracle 11g databases, you can import data from Oracle 11g to SQL Server SQL Server 2014 (or 2016) via a linked server. Then, the imported data can serve as the source for reports from SSRS.
While this tip highlighted the use of a sparkline report with a parameter, dynamic color coding and tooltips for sparkline markers, you can use any type of SSRS report with Oracle data via the approach demonstrated here. By importing data to SQL Server before starting report generation, you remove the need to connect directly from SSRS with another database in order to leverage SSRS.
The resource files folder for this tip include the project files for the SSIS and SSRS projects mentioned in the tip along with other scripts that you may find useful. Please be sure and review the readme.txt file in the resource solution folder before trying to reproduce any results in the tip based on the files in the resource files folder.
Download Resources for this tip


About the author
 Rick Dobson is an author and an individual trader. He is also a SQL Server professional with decades of T-SQL experience that includes authoring books, running a national seminar practice, working for businesses on finance and healthcare development projects, and serving as a regular contributor to MSSQLTips.com. He has been growing his Python skills for more than the past half decade -- especially for data visualization and ETL tasks with JSON and CSV files. His most recent professional passions include financial time series data and analyses, AI models, and statistics. He believes the proper application of these skills can help traders and investors to make more profitable decisions.
This author pledges the content of this article is based on professional experience and not AI generated.
View all my tips
