Problem
I need to calculate the Pearson Product-Moment Correlation Coefficient for two sets of measurements that are stored in my SQL Server database. How can I do this?
Solution
The Pearson Product-Moment Correlation Coefficient, also known more simply as the Pearson coefficient, is a mathematical calculation to determine how well two sets of data linearly correlate.
The Pearson coefficient can have a value from -1 to +1 inclusive. The closer the Pearson coefficient is to +1, the stronger the positive correlation. In other words, as the values of the first measurement increase, so do the values of the second measurement. The closer the Pearson coefficient is to -1, the stronger the negative correlation. In other words, as the values of the first measurement increase, the values of the second measurement decrease. A Pearson coefficient near 0, whether positive or negative, indicates there is little to no correlation between the two sets of data.
Once our data is in a table, writing a T-SQL query to calculate the Pearson product-moment correlation coefficient is fairly straightforward. However, because the calculation involves floating point numbers and division, we must be careful that all of our numbers are floating point so we don’t end up with a Pearson coefficient having only the integer values -1, 0 or +1. We will look at three examples in this tip. The first is a positive correlation, the second is a negative correlation and the third has no correlation. Examining each of these cases will also help us to test our code to make sure it is accurate. In all three examples, we will be calculating the Pearson product-moment correlation coefficient between Measurement A and Measurement B.
Pearson Product-Moment Correlation Coefficient
The T-SQL we will use to calculate the Pearson product-moment correlation coefficient is shown below. It is crucial for the parentheses to be placed correctly to ensure the proper order of operations.
(Avg(measurementA * measurementB) - (Avg(measurementA) * Avg(measurementB)))
/ (StDevP(measurementA) * StDevP(measurementB))
Pearson Positive Correlation Example
Let’s begin with our positive correlation example. The T-SQL code below will create a table that will have columns for Measurement A and Measurement B. The insert statements will insert 20 rows into the table.
create table dbo.tblPositiveCorrelation
(
 pkID integer identity(1,1) primary key,
 measurementA float,
 measurementB float
)
go
insert into dbo.tblPositiveCorrelation values (1.23350258, 1.095695912)
insert into dbo.tblPositiveCorrelation values (2.740809824, 2.515451457)
insert into dbo.tblPositiveCorrelation values (3.921364427, 3.535163576)
insert into dbo.tblPositiveCorrelation values (5.727112392, 5.440233141)
insert into dbo.tblPositiveCorrelation values (7.20400738, 7.034966693)
insert into dbo.tblPositiveCorrelation values (8.631639604, 8.657499396)
insert into dbo.tblPositiveCorrelation values (9.861575884, 10.25266377)
insert into dbo.tblPositiveCorrelation values (11.26773017, 11.26025417)
insert into dbo.tblPositiveCorrelation values (12.5538764, 12.73863763)
insert into dbo.tblPositiveCorrelation values (13.77519226, 14.52156486)
insert into dbo.tblPositiveCorrelation values (15.75008844, 16.27021747)
insert into dbo.tblPositiveCorrelation values (16.8040222, 18.04587966)
insert into dbo.tblPositiveCorrelation values (18.63079433, 19.52058173)
insert into dbo.tblPositiveCorrelation values (20.39947639, 21.38713489)
insert into dbo.tblPositiveCorrelation values (21.97242484, 22.42767485)
insert into dbo.tblPositiveCorrelation values (23.19091439, 24.18502987)
insert into dbo.tblPositiveCorrelation values (24.28721758, 26.09195563)
insert into dbo.tblPositiveCorrelation values (26.24160723, 27.51123988)
insert into dbo.tblPositiveCorrelation values (27.33126123, 28.93676183)
insert into dbo.tblPositiveCorrelation values (28.73483376, 29.97030518)
go
Next, we will run the T-SQL below to calculate the Pearson coefficient. We will also output the values for the numerator and denominator to help us verify the formula is correct.
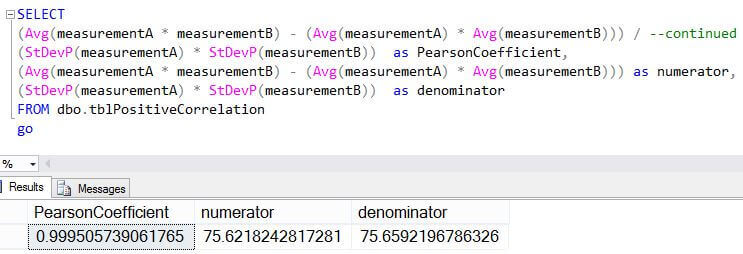
SELECT
(Avg(measurementA * measurementB) - (Avg(measurementA) * Avg(measurementB))) / (StDevP(measurementA) * StDevP(measurementB))  as PearsonCoefficient,
(Avg(measurementA * measurementB) - (Avg(measurementA) * Avg(measurementB))) as numerator,
(StDevP(measurementA) * StDevP(measurementB))  as denominator
FROM dbo.tblPositiveCorrelation
The image below shows our results. Notice the value for the Pearson coefficient is close to +1 which indicates a strong positive correlation.
Pearson Negative Correlation Example
Next, we will move to our negative correlation example. We will use the T-SQL below to create and populate a separate table.
create table dbo.tblNegativeCorrelation
(
 pkID integer identity(1,1) primary key,
 measurementA float,
 measurementB float
)
go
insert into dbo.tblNegativeCorrelation values (1.581662726, 29.65152293)
insert into dbo.tblNegativeCorrelation values (3.4369907, 28.01601842)
insert into dbo.tblNegativeCorrelation values (5.20372199, 26.64762377)
insert into dbo.tblNegativeCorrelation values (6.548564275, 25.52941989)
insert into dbo.tblNegativeCorrelation values (8.236812206, 24.46357622)
insert into dbo.tblNegativeCorrelation values (9.37715358, 22.94984262)
insert into dbo.tblNegativeCorrelation values (10.51055702, 21.25097239)
insert into dbo.tblNegativeCorrelation values (11.82382087, 19.31299184)
insert into dbo.tblNegativeCorrelation values (13.40427251, 17.97538895)
insert into dbo.tblNegativeCorrelation values (15.24348405, 16.23958242)
insert into dbo.tblNegativeCorrelation values (16.64768328, 14.69010224)
insert into dbo.tblNegativeCorrelation values (18.04064143, 12.86494034)
insert into dbo.tblNegativeCorrelation values (19.51671012, 11.4152393)
insert into dbo.tblNegativeCorrelation values (20.58177787, 10.30092096)
insert into dbo.tblNegativeCorrelation values (22.04140726, 8.625347334)
insert into dbo.tblNegativeCorrelation values (23.81958423, 6.721438358)
insert into dbo.tblNegativeCorrelation values (25.02552769, 5.340616899)
insert into dbo.tblNegativeCorrelation values (26.9841361, 3.958114624)
insert into dbo.tblNegativeCorrelation values (28.04718847, 2.624742871)
insert into dbo.tblNegativeCorrelation values (29.6213496, 1.264092442)
go
The T-SQL that calculates the Pearson coefficient is the same as above except for the differing table name.
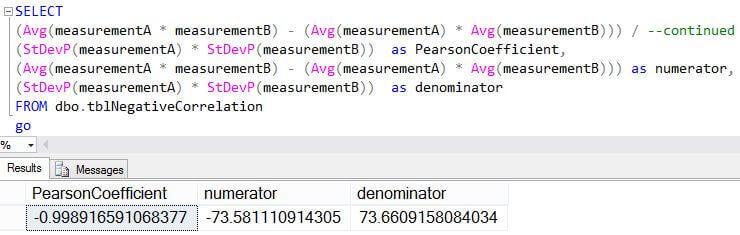
SELECT
(Avg(measurementA * measurementB) - (Avg(measurementA) * Avg(measurementB))) / --continued
(StDevP(measurementA) * StDevP(measurementB))  as PearsonCoefficient,
(Avg(measurementA * measurementB) - (Avg(measurementA) * Avg(measurementB))) as numerator,
(StDevP(measurementA) * StDevP(measurementB))  as denominator
FROM dbo.tblNegativeCorrelation
go
The results of the query are shown below. Notice how the Pearson coefficient is almost -1, which indicates a negative correlation.
Pearson No Correlation Example
Finally, we will look at an example where there is little to no correlation. As in the previous examples, we will use the T-SQL below to create and populate a separate table.
create table dbo.tblNoCorrelation
(
 pkID integer identity(1,1) primary key,
 measurementA float,
 measurementB float
)
go
insert into dbo.tblNoCorrelation values (0.80544264, 0.16208355)
insert into dbo.tblNoCorrelation values (0.895563605, 0.764382306)
insert into dbo.tblNoCorrelation values (0.169711771, 0.958280698)
insert into dbo.tblNoCorrelation values (0.377226503, 0.26927763)
insert into dbo.tblNoCorrelation values (0.695216156, 0.889767386)
insert into dbo.tblNoCorrelation values (0.864166528, 0.93030605)
insert into dbo.tblNoCorrelation values (0.909937206, 0.146715435)
insert into dbo.tblNoCorrelation values (0.126278394, 0.090460955)
insert into dbo.tblNoCorrelation values (0.743036786, 0.284939579)
insert into dbo.tblNoCorrelation values (0.482858255, 0.958005081)
insert into dbo.tblNoCorrelation values (0.452936554, 0.521588833)
insert into dbo.tblNoCorrelation values (0.232092942, 0.891831068)
insert into dbo.tblNoCorrelation values (0.303048204, 0.543747358)
insert into dbo.tblNoCorrelation values (0.562067989, 0.852912301)
insert into dbo.tblNoCorrelation values (0.752175511, 0.721606105)
insert into dbo.tblNoCorrelation values (0.09224805, 0.443346524)
insert into dbo.tblNoCorrelation values (0.390609317, 0.470526115)
insert into dbo.tblNoCorrelation values (0.925485575, 0.815146232)
insert into dbo.tblNoCorrelation values (0.598509836, 0.060795557)
insert into dbo.tblNoCorrelation values (0.87523696, 0.334668821)
go
The T-SQL below will calculate the Pearson coefficient for the table that was created and populated above.
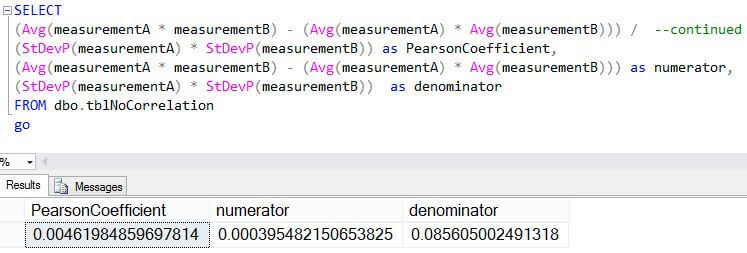
SELECT
(Avg(measurementA * measurementB) - (Avg(measurementA) * Avg(measurementB))) /  --continued
(StDevP(measurementA) * StDevP(measurementB)) as PearsonCoefficient,
(Avg(measurementA * measurementB) - (Avg(measurementA) * Avg(measurementB))) as numerator,
(StDevP(measurementA) * StDevP(measurementB))  as denominator
FROM dbo.tblNoCorrelation
go
As we can see in the image below, the value for the Pearson coefficient is close to zero, which indicates little to no correlation.
Checking Pearson Calculations
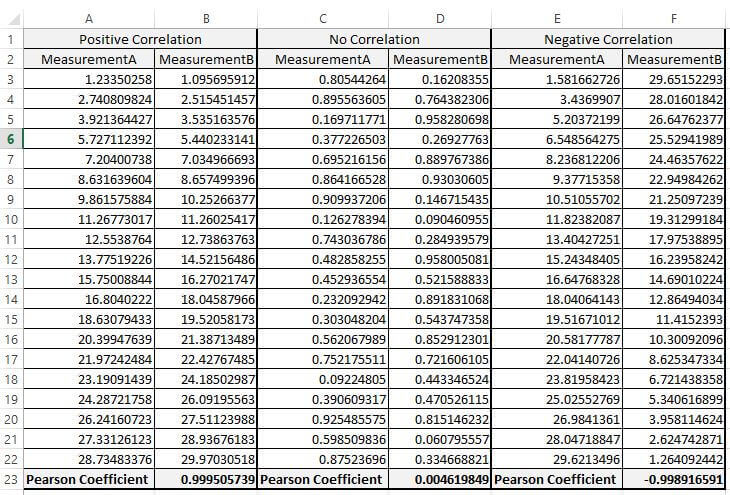
Just to make sure our calculations are correct, I entered the values from all three tables into Excel and performed three separate Pearson coefficient calculations using the Pearson function in Excel. As we see below our T-SQL result is similar to the Excel result. One more thing, if the calculated value is outside the range of -1 to +1 inclusive, then there is an error in the query.
Next Steps
Please experiment with how different data values affect the Pearson value. Also, please check out these other tips on mathematical functions in T-SQL on MSSQLTips.com.
- SQL Server T-SQL Code to Calculate a Moving Average
- Avoiding erroneous results when using T-SQL Trigonometric Functions in SQL Server 2012
- Transforming Cartesian Coordinates to Spherical Coordinates in SQL Server with T-SQL
- Using T-SQL to Perform Z-Score Column Normalization in SQL Server
- Plotting a Bell Curve in SQL Server Reporting Services

Dr. Dallas Snider is an Assistant Professor in the Computer Science Department at the University of West Florida. He received his Ph.D. in Integrated Computing and M.S. in Instrumental Sciences from the University of Arkansas at Little Rock. He received a B.A. in Physics from Hendrix College. Before joining UWF, he worked as a data warehouse developer for Northrop Grumman Information Systems and prior to that as a database application developer for Acxiom and Euronet. Dr. Snider’s teaching and research interests include data mining, data warehousing, information visualization, and software development.