By: Siddharth Mehta | Comments | Related: > Analysis Services Administration
Problem
Monitoring queries that are executed against a database is a common task for administrators as well as developers for debugging and analysis purposes. Consider a scenario where one wishes to track the queries being executed against a SQL Server Analysis Services (SSAS) Tabular 2016 database without using SQL Server Profiler, either due to lack of privileges to access Profiler or due to Profiler being considered a high resource intensive tool. Read this tip to learn more.
Solution
SQL Server Analysis Services (SSAS) as well as SQL Server Management Studio (SSMS) supports the need for monitoring SSAS events using Extended Events, which can be used to intercept queries.
Extended Events (xEvents) is a light-weight tracing and performance monitoring system that uses very few system resources, making it an ideal tool for diagnosing problems. In this tip we will configure an Extended Events session and look at an example of intercepting a DAX query executed using SSMS.
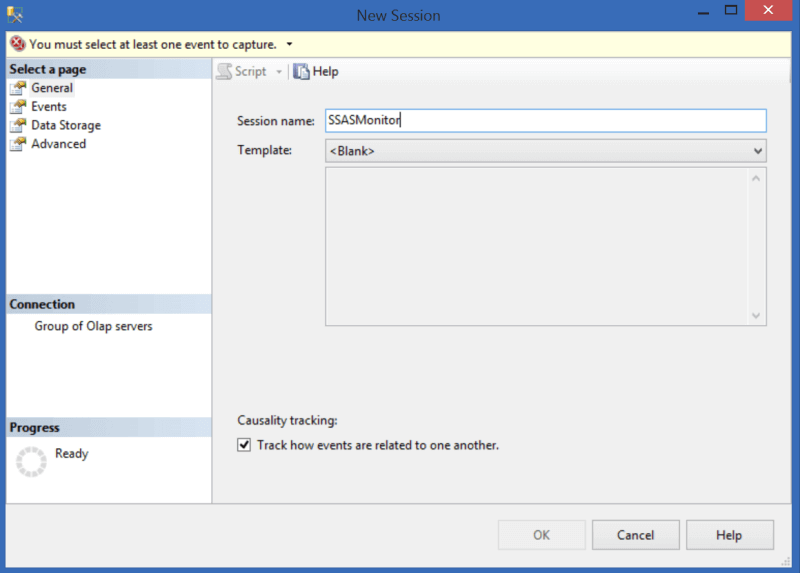
Step 1: Open SSMS and log on to your SSAS Tabular instance, where you should have at least one SSAS Tabular database available. Open the Management folder, right-click the Sessions folder and select the menu item "New Session". Provide an appropriate name for the session as shown below.
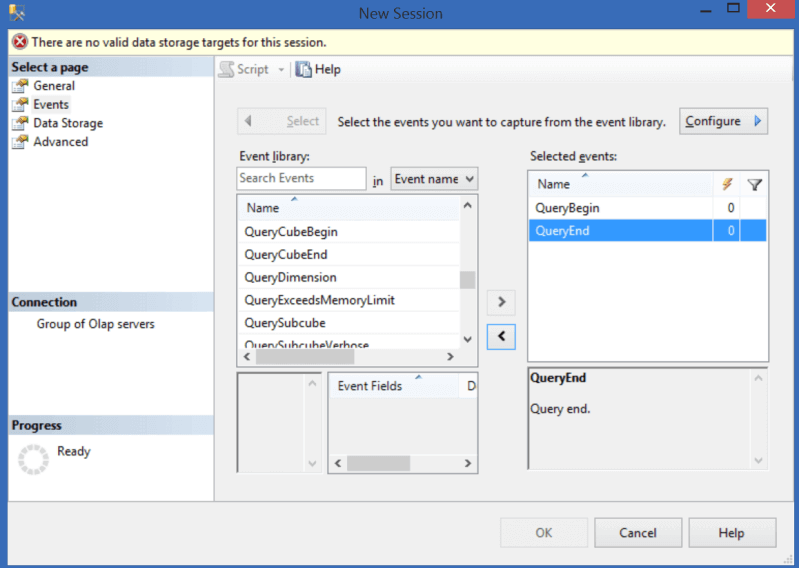
Step 2: Click on the events tab and select the QueryBegin and QueryEnd events as shown below. You can select the events of your choice from the events list, and in case you wish to configure the properties of these events, you can do so by clicking the Configure button on the top.
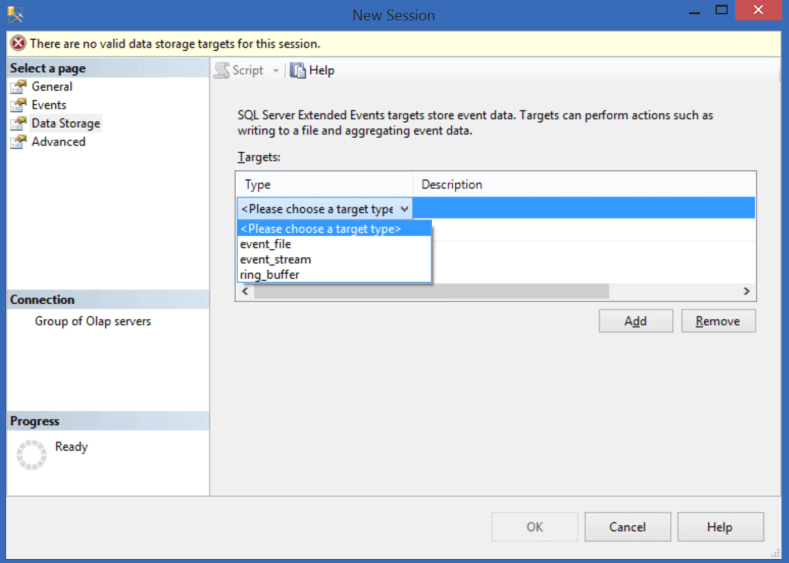
Step 3: Click on the data storage tab and select the event_stream option as shown below, and click on the Add button. You can set up live data stream to monitor server activity in real time, keep session data loaded in memory for faster analysis, or save data streams to a file for offline analysis by selecting the corresponding options.
Step 4: After the above step, click on the Script button, which should open a script as shown below. Execute this script in SSMS.

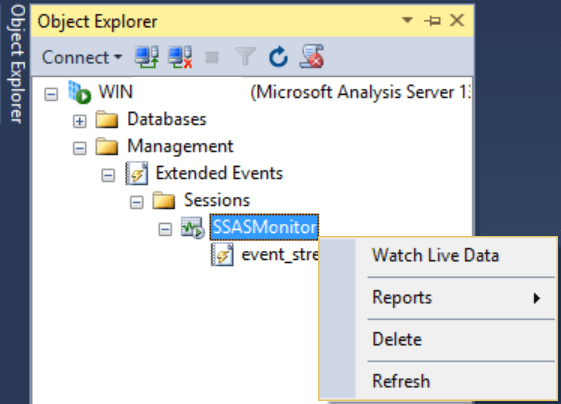
Step 5: Refresh the Sessions folder and you should be able to find the new session that we created in the above step. Select the session, right-click on it and select the menu item "Watch Live Data" as shown below.
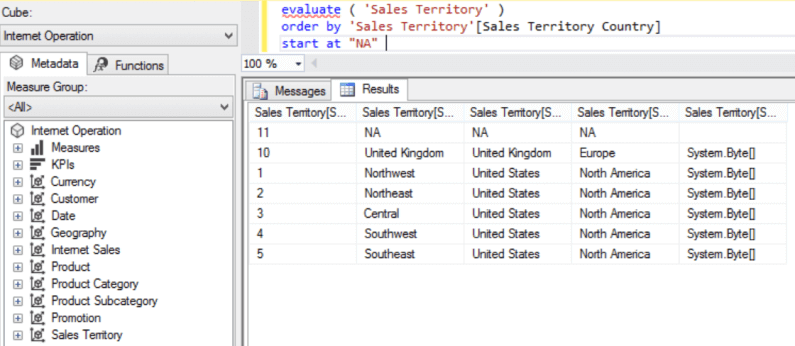
Step 6: Open a new MDX query window in SSMS, with a connection to the SSAS Tabular database and execute any DAX or MDX query. Here I am executing a simple DAX query as shown below.
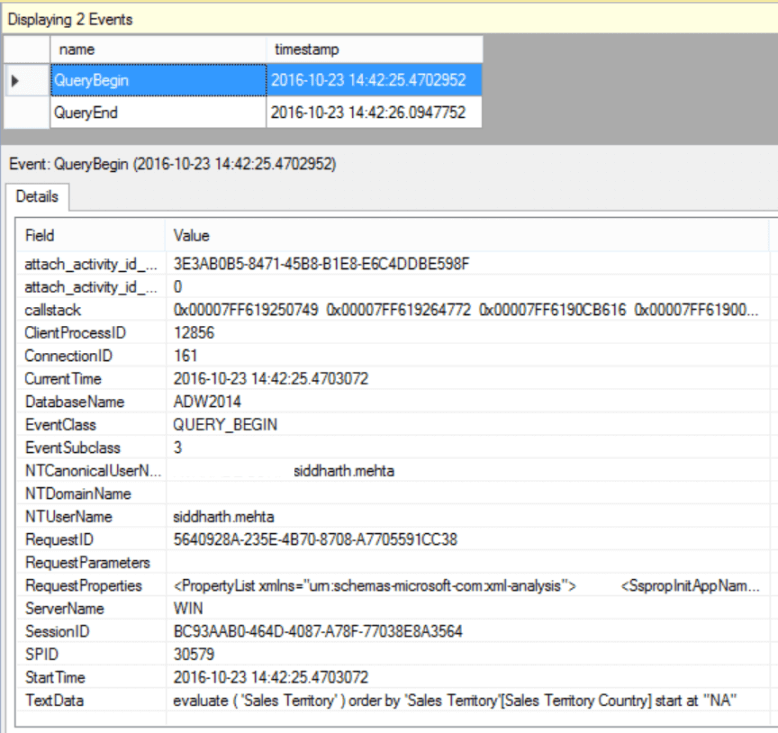
Step 7: Switch to the Extended Events session we opened in step 5. You should be able to find the corresponding events we selected earlier. Click on the QueryBegin event, and you should be able to find the relevant details like database name, the query and the details of the user who executed the query.
In this way we can use Extended Events in SSMS to intercept and monitor different events and actions for a SSAS Tabular 2016 database.
Next Steps
- Try to configure more than one session with different data storage targets, and intercept MDX queries executed against SSAS Tabular databases.
- Read more SSAS tips
About the author
 Siddharth Mehta is an Associate Manager with Accenture in the Avanade Division focusing on Business Intelligence.
This author pledges the content of this article is based on professional experience and not AI generated.
View all my tips


