Problem
Using scalar User Defined Function (UDF) generally causes SQL Server performance issues when used on a large number of rows, because it is evaluated for each row returned by the query. This tip will describe some things you should know when working with queries that use SQL Server scalar UDFs.
Solution
When troubleshooting or just trying to understand SQL Server query performance when using scalar UDFs, your analysis can be distorted due to few distinct behaviors of scalar UDFs.
This tip outlines a few behaviors and things to know when working with the intricacies associated with scalar UDFs, such as:
- Serial query plan generation
- Scalar UDF operator cost is always zero in the query plan
- A detailed trace can impact query performance of a query with a scalar UDF
- STATISTICS IO is not included
This tip will walk through the points above using SQL Server 2016 Developer Edition SP1 using the WideWorldImports database.
Serial query plan generation
The query below, without a UDF, will produce a query plan which uses parallelism. When this query is executed, it takes approximately 1.5 seconds to complete execution as indicated by the SET STATISTICS TIME ON option.
USE WideWorldImporters
GO
SET STATISTICS TIME ON
GO
SELECT TOP 5000 *
FROM [Sales].[InvoiceLines] po
JOIN [Sales].[OrderLines] pl
ON po.[StockItemID] = pl.[StockItemID]
-----------------------------------------------
SQL Server Execution Times:
   CPU time = 3078 ms, elapsed time = 1572 ms.

A scalar UDF is created for testing purposes as below.
USE [WideWorldImporters]
GO
CREATE FUNCTION dbo.ufn_GetTotalQuantity (@StockItemID INT)
RETURNS INT
AS
BEGIN
        DECLARE @Qty INT
        SELECT @Qty = SUM(Quantity)
        FROM Warehouse.StockItemTransactions
        WHERE StockItemID = @StockItemID
        RETURN (@Qty)
END
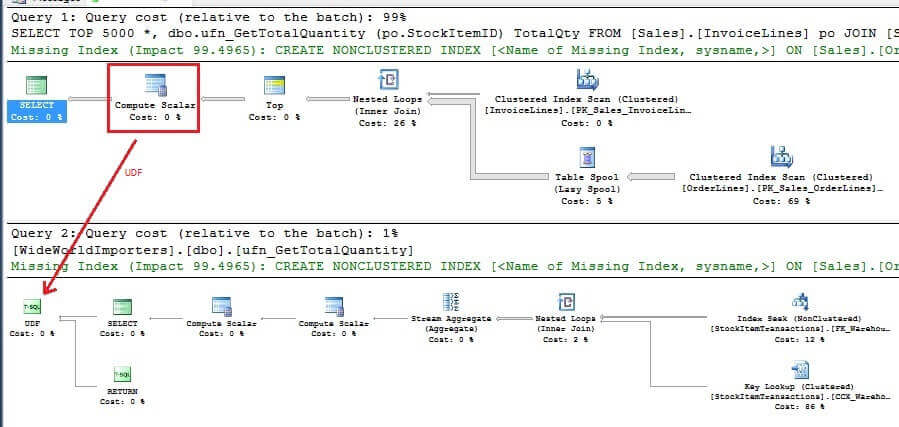
We now reference the scalar UDF in the first query and then check the query plan again. As expected, the Parallelism operator has disappeared from the execution plan. The query now took 11 seconds to complete execution.
USE WideWorldImporters
GO
SET STATISTICS TIME ON
GO
SELECT TOP 5000 *, dbo.ufn_GetTotalQuantity (po.StockItemID) TotalQty
FROM [Sales].[InvoiceLines] po
JOIN [Sales].[OrderLines] pl
ON po.[StockItemID] = pl.[StockItemID]
-----------------------------------------------
SQL Server Execution Times:
   CPU time = 10704 ms,  elapsed time = 10897 ms.
The Compute Scalar operator in the query plan represents a scalar computation and returns a computed value. In the query plan below, it represents the operation which the scalar UDF performs. SQL Server automatically provides the query plan of the scalar UDF at the bottom pane as shown below.
Things to Note
SQL Server disables parallelism for queries that use a scalar UDF. But sometimes, the query itself could already be executing very slowly without the scalar UDF. So, you might want to remove the scalar UDF from the query to see if SQL Server is able to leverage parallelism. It does not mean SQL Server will definitely use parallelism in a query without a scalar UDF, but it may. This helps to understand if the main performance bottleneck might be with the main query structure itself and the effect of parallelism (if SQL Server decides to parallelize the query).
The bottom pane (Query 2) represents the query plan of the scalar UDF. This provides a convenient and valuable insight into the query execution of the scalar UDF. In this case, SQL Server decides to perform an Index Seek which is typically efficient to retrieve a small number of rows. But bear in mind each row iteration from the main query will use this query plan. If there is a large difference in terms of row count in column StockItemID, the Index Seek in the query plan will not be efficient to retrieve a large number of rows. This scenario can vastly complicate a query tuning exercise.
Scalar UDF operator cost is always zero in the query plan
We now know that a scalar UDF disables parallelism. We will now disable parallelism on the query without the scalar UDF using MAXDOP 1 to compare the query plan of the query which references the scalar UDF.
Looking at both query plans, they contain the exact same query cost relative to each other. The only difference is the query plan which contains the scalar UDF carries a Compute Scalar operator with a cost of 0.
USE WideWorldImporters
GO
SELECT TOP 5000 *
FROM [Sales].[InvoiceLines] po
JOIN [Sales].[OrderLines] pl
ON po.[StockItemID] = pl.[StockItemID]
OPTION (MAXDOP 1)
GO
SELECT TOP 5000 *, dbo.ufn_GetTotalQuantity (po.StockItemID) TotalQty
FROM [Sales].[InvoiceLines] po
JOIN [Sales].[OrderLines] pl
ON po.[StockItemID] = pl.[StockItemID]
GO

Executing the query without the scalar UDF using MAXDOP 1 completes execution in approximately 3 seconds. This is still faster than the query that references the scalar UDF which returned results in 11 seconds.
USE WideWorldImporters
GO
SET STATISTICS TIME ON
GO
SELECT TOP 5000 *
FROM [Sales].[InvoiceLines] po
JOIN [Sales].[OrderLines] pl
ON po.[StockItemID] = pl.[StockItemID]
OPTION (MAXDOP 1)
GO
-----------------------------------------------
SQL Server Execution Times:
   CPU time = 2906 ms,  elapsed time = 2951 ms.
Things to Note
The Compute Scalar operator cost for scalar UDF will always be 0 in the main query plan. The scalar UDF query plan cost is displayed separately in the bottom pane. Hence, the main query cost estimate comparison can be misleading when comparing the query plan which contains a scalar UDF and without.
Detailed trace can impact query performance of query with scalar UDF
Depending on how much and what trace data are captured, row-by-agonizing-row processing behavior due to using a scalar UDF can add overhead when capturing metrics using SQL Server Profiler.
The table below shows the execution duration of the same query when tracing is enabled in the background. To show the effect of the overhead, the query result set is increased to return 50,000 rows.
USE WideWorldImporters
GO
SELECT TOP 50000 *
FROM [Sales].[InvoiceLines] po
JOIN [Sales].[OrderLines] pl
ON po.[StockItemID] = pl.[StockItemID]
GO
SELECT TOP 50000 *, dbo.ufn_GetPrice (po.StockItemID) Price
FROM [Sales].[InvoiceLines] po
JOIN [Sales].[OrderLines] pl
ON po.[StockItemID] = pl.[StockItemID]
GO
Execution Duration (seconds) | |||
|---|---|---|---|
| Client side trace | Server side trace | Extended Events | |
| Query without scalar UDF | 1.3 | 1.3 | 1.4 |
| Query with scalar UDF | 60.0 | 50.7 | 44.9 |
SQL Server Profiler and Extended Events output can be grouped to provide a more organized view of the trace data to show execution metrics when trying to understand queries with a scalar UDF.
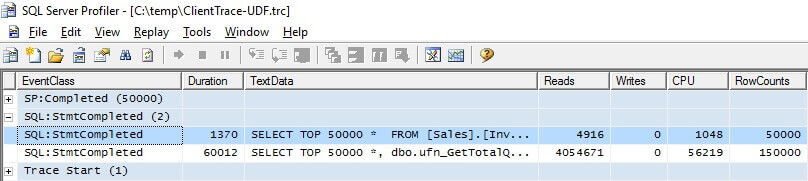
Client Side Trace
Server Side Trace

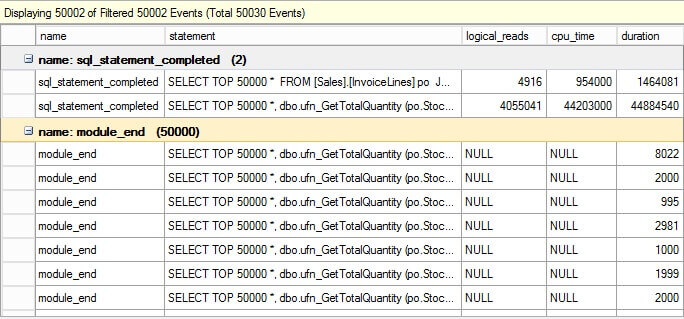
Extended Events
The same trace events are captured with Extended Events. Note that SP:Completed no longer has the same name, it is now called module_end in Extended Events.
Things to Note
SQL Server Profiler trace reports the correct STATISTICS IO, but it pushes up the query execution time slightly. The more trace records and events are captured, the heavier the impact of tracing will have on the query performance.
The lightest tracing with very minimal overhead is Extended Events, followed by a server side trace and higher overhead using a client side trace. This is true for any typical tracing scenario on SQL Server.
STATISTICS IO is not included
The number of rows returned in the query is now set to 50000. STATISTICS IO is turned on and the two queries below are executed.
USE WideWorldImporters
GO
SET STATISTICS IO ON
GO
SELECT TOP 50000 *
FROM [Sales].[InvoiceLines] po
JOIN [Sales].[OrderLines] pl
ON po.[StockItemID] = pl.[StockItemID]
OPTION (MAXDOP 1)
GO
SELECT TOP 50000 *, dbo.ufn_GetTotalQuantity (po.StockItemID) Price
FROM [Sales].[InvoiceLines] po
JOIN [Sales].[OrderLines] pl
ON po.[StockItemID] = pl.[StockItemID]
GO
Here is the output:
--------------------------------------------------------
(50000 row(s) affected)
Table 'InvoiceLines'. Scan count 1, logical reads 40, physical reads 0, read-ahead reads 0, lob logical reads 0, lob physical reads 0, lob read-ahead reads 0.
Table 'OrderLines'. Scan count 1, logical reads 4631, physical reads 0, read-ahead reads 0, lob logical reads 0, lob physical reads 0, lob read-ahead reads 0.
The STATISTICS IO output shows the exact same reads in both outputs. So STATISTICS IO excludes disk activity generated by a scalar UDF, because otherwise the numbers for the query with a scalar UDF should have been much higher.
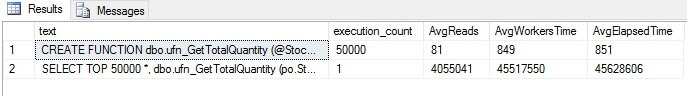
We will now check on SQL Server DMV sys.dm_exec_query_stats. The number in AvgReads column matches the reads reported by Extended Events. So, DMV sys.dm_exec_query_stats does include disk activity generated by a scalar UDF.
SELECT
 text
 , execution_count
 , total_logical_reads / execution_count  AvgReads
 , total_worker_time / execution_count  AvgWorkersTime
 , total_elapsed_time / execution_count  AvgElapsedTime
FROM  sys.dm_exec_query_stats
CROSS APPLY sys.dm_exec_sql_text(sql_handle)
WHERE text LIKE '%ufn_GetTotalQuantity%'
OPTION (RECOMPILE)
Things to Note
Reads generated from the STATISTICS IO option is misleading because it excludes disk activity generated by a scalar UDF. DMVs however, will report accurate IO statistics. So, a great alternative to start gathering scalar UDF statistics would be using SQL Server DMVs.
Additional Content
Please download the definition of the server side trace and Extended Events here.
Summary
Scalar UDFs have a need and can be a viable option to encapsulate reusable code in instances such as when the requirement is to evaluate a single row only across many different queries.
Scalar UDFs are definitely not suitable to be operated against a large number of rows and this is where it has gained a very bad reputation because of this misuse.
Next Steps
- Learn about SET STATISTICS IO (Transact-SQL)
- More on Troubleshoot SQL Server Function Performance with the sys.dm_exec_function_stats DMV

Simon Liew is an independent SQL Server Consultant in Sydney, Australia. He is a Microsoft Certified Master for SQL Server 2008 and holds a Master’s Degree in Distributed Computing.
- MSSQLTips Awards: Trendsetter (25+tips) – 2017 | Author of the Year Contender – 2016, 2017


