By: Daniel Farina | Comments (1) | Related: > SQL Server 2016
Problem
You need to collect execution statistics for a function. In previous versions of SQL Server the only way to obtain these statistics was by looking at individual statements within the function. In this tip I will introduce a new system view that will give us the execution statistics of the whole function.
Solution
Starting with version 2005, SQL Server added system views that collect statistics for query executions. This was improved on SQL Server 2008 with the addition of new Dynamic Management Views to keep track of stored procedures (sys.dm_exec_procedure_stats) and triggers (sys.dm_exec_trigger_stats). Now with SQL Server 2016 we have another improvement, a new Dynamic Management View that returns performance statistics of cached functions. The new system view I am referring is sys.dm_exec_function_stats.
SQL Server sys.dm_exec_function_stats Dynamic Management View
This sys.dm_exec_function_stats Dynamic Management View keeps execution statistics for scalar functions including both in-memory and CLR scalar functions. The view returns one row for every scalar function as long as it has a cached execution plan. It’s not surprising, because the same happens with the similar system views like sys.dm_exec_query_stats.
Considerations for In-Memory Functions
When you look at the execution statistics of In-Memory functions, you won’t be able to get information on the columns related to logical or physical IO. Instead those columns will be set to zero. On the contrary you will be able to query for worker statistics and the number of executions.
Sample
For the purposes of this test I will be using the Adventure Works 2014 sample database which you can download for free from Codeplex by following this link: https://msftdbprodsamples.codeplex.com/releases/view/125550.
I made two simple queries; the first one contains scalar function calls, and the other joins a table with a table valued function. This way we can see how the sys.dm_exec_function_stats displays its execution statistics.
Here is the query that calls two Scalar Functions: dbo.ufnGetProductListPrice and dbo.ufnGetStock, both from AdventureWorks2014 database.
USE AdventureWorks2014
GO

SELECT  OH.PurchaseOrderNumber ,
        dbo.ufnGetProductListPrice(OD.ProductID, OH.OrderDate) ListPrice ,
        OD.UnitPRice ,
        OD.OrderQty ,
        OD.LineTotal ,
        dbo.ufnGetStock(OD.ProductID) RemainingStock
FROM    Sales.SalesOrderHeader OH
        INNER JOIN Sales.SalesOrderDetail OD
        ON OH.SalesOrderID = OD.SalesOrderID
GO
The following query execution will create an entry in cache for the dbo.ufnGetContactInformation Table Valued Function of the AdventureWorks 2014 database, but as I previously explained, it won’t show a record in the sys.dm_exec_function_stats system view.
USE AdventureWorks2014
GO

SELECT  *
FROM    Sales.SalesOrderHeader OH
        CROSS APPLY dbo.ufnGetContactInformation(OH.SalesPersonID)
GO
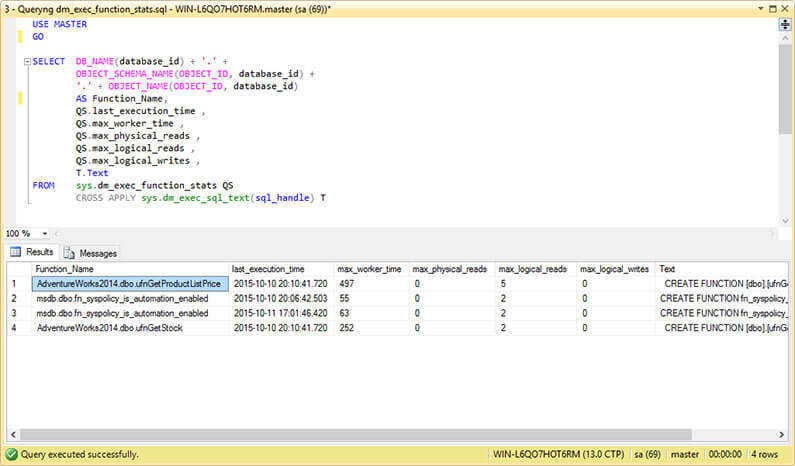
After executing the previous scripts we are now ready to query the sys.dm_exec_function_stats Dynamic Management View. The next query will return the fully qualified function name and its maximum times as well as the function code.
USE MASTER
GO

SELECT  DB_NAME(database_id) + '.' +
		OBJECT_SCHEMA_NAME(OBJECT_ID, database_id) +
        '.' + OBJECT_NAME(OBJECT_ID, database_id)
		AS Function_Name,
        QS.last_execution_time ,
        QS.max_worker_time ,
        QS.max_physical_reads ,
        QS.max_logical_reads ,
        QS.max_logical_writes ,
        T.Text
FROM    sys.dm_exec_function_stats QS
        CROSS APPLY sys.dm_exec_sql_text(sql_handle) T
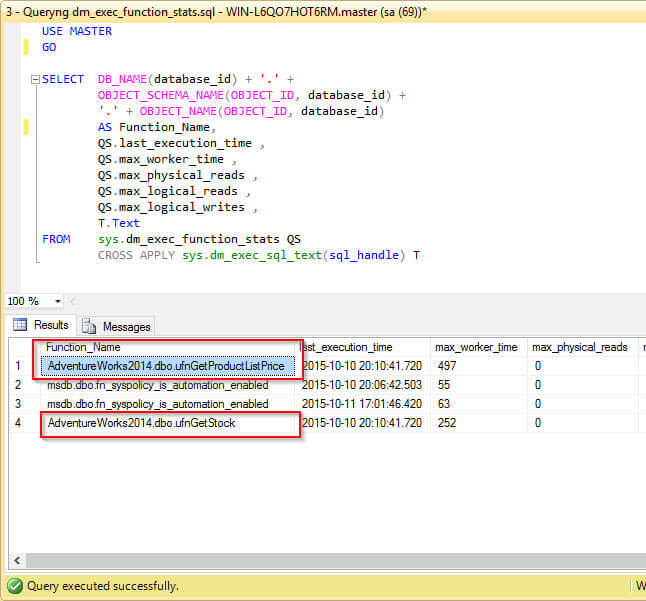
As you can see on the next two images querying sys.dm_exec_function_stats only shows the statistics of the two scalar functions from the first query.


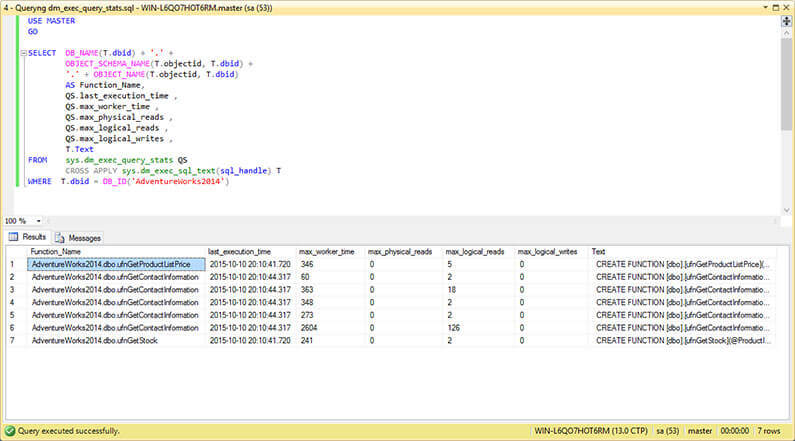
But you may be asking, what if I need execution statistics of Table Valued Functions. In such case, since sys.dm_exec_function_stats is very similar to sys.dm_exec_query_stats, we can adapt the previous query to use the sys.dm_exec_query_stats system view.
USE MASTER
GO

SELECT  DB_NAME(T.dbid) + '.' +
		OBJECT_SCHEMA_NAME(T.objectid, T.dbid) +
        '.' + OBJECT_NAME(T.objectid, T.dbid)
		AS Function_Name,
        QS.last_execution_time ,
        QS.max_worker_time ,
        QS.max_physical_reads ,
        QS.max_logical_reads ,
        QS.max_logical_writes ,
        T.Text
FROM    sys.dm_exec_query_stats QS
        CROSS APPLY sys.dm_exec_sql_text(sql_handle) T
WHERE  T.dbid = DB_ID('AdventureWorks2014')
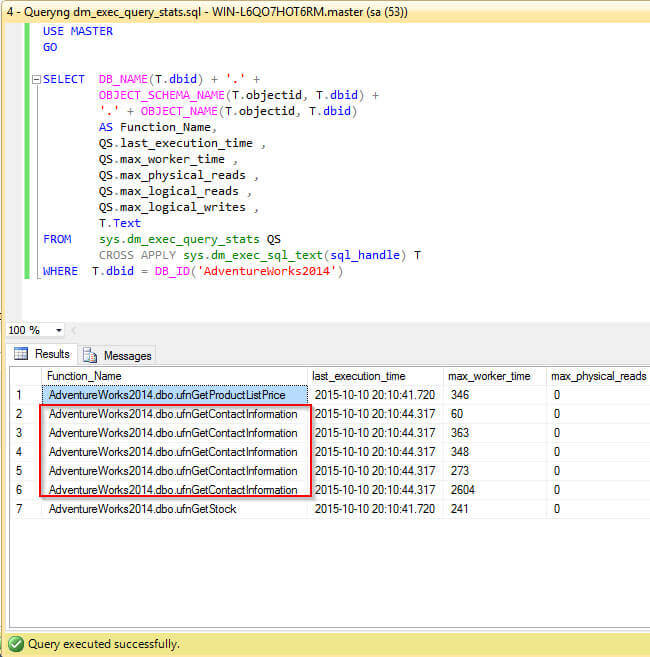
After executing the previous query you should see something similar to the next images. Notice that the result shows details about the execution statistics for the dbo.ufnGetContactInformation Table Valued Function as well as the two scalar functions.


Next Steps
- You can download an evaluation copy of SQL Server 2016 from this link: https://www.microsoft.com/en-us/evalcenter/evaluate-sql-server-2016.
- Also you can download the AdventureWorks2014 database as well as other test databases from this link: https://msftdbprodsamples.codeplex.com/releases/view/125550.
- Since sys.dm_exec_function_stats is very similar to sys.dm_exec_procedure_stats and sys.dm_exec_query_stats you can reuse the queries of those system views with little effort. Take this tip as an example: Several Methods to collect SQL Server Stored Procedure Execution History
- If you need more information about Dynamic Management Views check out Dynamic Management Views and Functions Tips Category.
- You can find more tips about Performance Tuning on Performance Tuning Tips Category.
- Stay tuned on SQL Server 2016 Tips Category for more information about this release of SQL Server.
About the author
 Daniel Farina was born in Buenos Aires, Argentina. Self-educated, since childhood he showed a passion for learning.
This author pledges the content of this article is based on professional experience and not AI generated.
View all my tips


