By: Svetlana Golovko | Comments (24) | Related: > Stored Procedures
Problem
One of our developers after reviewing the SQL Server database objects of an old database found that the database has too many stored procedures to reasonably manage them all. He thinks that most of the procedures are not in use, but he wants to get more information about the stored procedure usage before we delete them. Our task is to provide the developers with a list of stored procedures for specific databases with the date when the stored procedures was last executed. What are the options to accomplish this task?
Solution
In this tip we will provide several monitoring methods that could be utilized by DBAs to determine stored procedure execution history.
Capture SQL Server Stored Procedure History with Profiler
The quick and simple way to monitor the stored procedures execution is setting up a Trace with SQL Server Profiler. This is probably good for a quick check when a user runs a process in Test and you want to capture what is he/she running. Unfortunately, this method has several disadvantages:
- Profiler adds performance overhead to the server
- A single session does not "survive" a server reboot
- Profiler is being replaced with Extended Events
To access SQL Server Profiler navigate to Start | All Programs | SQL Server 2012 | Performance Tools | SQL Server Profiler.
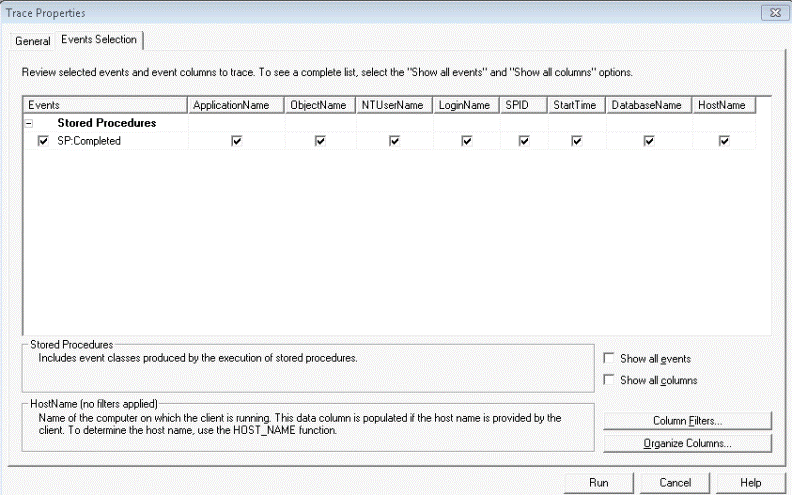
To start a new session, navigate to File | New Trace. Connect to your SQL Server instance when prompted. On the Trace Properties screen, click on the Events Selection tab and select the SP:Completed counter in the Stored Procedures grouping of counters. Click on the General Tab to save the results to a table or file.
If you do not see this counter, check the "Show all events" check box on the bottom right of the interface.
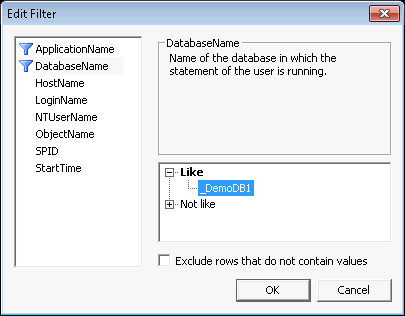
Set he columns filter to capture only the database that you are monitoring, which is accessed by clicking on the "Column Filters" button on the bottom right of the interface (see image above).
Run the trace by clicking on the Run button.
Stop it after the period of time required for the monitoring.
Review the results:

Read more tips about SQL Server Profiler.
Capture SQL Server Stored Procedure History with Trace
This method described in this section is similar to SQL Profiler, but is more flexible and could be scheduled to start automatically after SQL Server restarts. It is also script based rather than using a GUI.
SQL Server Trace Script
-- Create a Queue
declare @rc int
declare @TraceID int
declare @maxfilesize bigint
set @maxfilesize = 10

-- Please replace the text InsertFileNameHere, with an appropriate
-- filename prefixed by a path, e.g., c:\MyFolder\MyTrace. The .trc extension
-- will be appended to the filename automatically. If you are writing from
-- remote server to local drive, please use UNC path and make sure server has
-- write access to your network share

exec @rc = sp_trace_create @TraceID output, 2, N'c:\MyFolder\MyTrace\SP_usage',
     @maxfilesize, NULL
if (@rc != 0) goto error

-- Client side File and Table cannot be scripted

-- Set the events
declare @on bit
set @on = 1
exec sp_trace_setevent @TraceID, 43, 6, @on
exec sp_trace_setevent @TraceID, 43, 8, @on
exec sp_trace_setevent @TraceID, 43, 10, @on
exec sp_trace_setevent @TraceID, 43, 11, @on
exec sp_trace_setevent @TraceID, 43, 12, @on
exec sp_trace_setevent @TraceID, 43, 14, @on
exec sp_trace_setevent @TraceID, 43, 34, @on
exec sp_trace_setevent @TraceID, 43, 35, @on


-- Set the Filters
declare @intfilter int
declare @bigintfilter bigint

exec sp_trace_setfilter @TraceID, 35, 0, 6, N'_DemoDB1'
-- Set the trace status to start
exec sp_trace_setstatus @TraceID, 1

-- display trace id for future references
select TraceID=@TraceID
goto finish

error:
select ErrorCode=@rc

finish:
go
Read more about SQL Trace here.
Both methods above should be used in older environments (for example, SQL Server 2005) that do not support Extended Events. Starting with SQL Server 2008 Microsoft introduced Extended Events that will replace Profiler and server side traces. Keep in mind that both of these will be deprecated in future versions of the SQL Server.
Using DMVs and SQL Server Agent Job to Capture Stored Procedure History
This method utilizes the sys.dm_exec_procedure_stats dynamic management view. It requires a table that will be populated with the DMV data.
To create the table use the following script:
CREATE TABLE dbo._demo_sp_exec_stats
    (object_id INT,
    database_id INT,
    proc_name NVARCHAR(128),
    last_execution_time DATETIME)
Then create a SQL Server Agent Job that will run every minute with this step:
MERGE INTO dbo._demo_sp_exec_stats STAT
USING
 (SELECT  d.object_id, d.database_id,
 OBJECT_NAME(object_id, database_id) AS proc_name,
 MAX( d.last_execution_time)  as last_execution_time
 FROM sys.dm_exec_procedure_stats AS d
 WHERE d.database_id = DB_ID('_DemoDB')
 GROUP BY  d.object_id, d.database_id,
 OBJECT_NAME(object_id, database_id)
 ) AS SRC
 ON STAT.object_id = SRC.object_id
WHEN MATCHED
 AND STAT.last_execution_time < SRC.last_execution_time THEN
  UPDATE SET last_execution_time = SRC.last_execution_time
WHEN NOT MATCHED THEN
 INSERT  (object_id, database_id, proc_name, last_execution_time)
 VALUES (SRC.object_id, SRC.database_id, SRC.proc_name, SRC.last_execution_time) ;
To view the results, query the dbo._demo_sp_exec_stats table:

Disadvantages of this method:
- It requires a table that will hold historical statistics (but you may already have a database that stores historical statistics and performance data)
- Execution statistics on a very busy SQL Server could be removed from the DMV before the job runs and therefore you miss data. The row with procedure execution statistics will be removed after the stored procedure is removed from the SQL Server cache (read more here).
Using a Custom Data Collector to Capture SQL Server Stored Procedure Usage
You can use this this solution if you already have Management Data Warehouse
(MDW) setup in your environment. Read more tips about Management Data Warehouse
here.
Using a query similar to the one that we used in the SQL Server Agent Job above, we can create a Custom Collection Set that uses the generic T-SQL Query Collector type. The advantage of this method is that you do not lose procedure execution history when this collector is in cache mode.
Here is the script for the custom data collector setup (the last statement will start the data collector):
USE msdb
GO
Begin Transaction
Begin Try
Declare @collection_set_id_15 int
Declare @collection_set_uid_16 uniqueidentifier
EXEC [msdb].[dbo].[sp_syscollector_create_collection_set]
 @name=N'Stored Procedure Usage - "_DemoDB" database',
 @collection_mode=0, -- cached mode
 @description=N'Collects information about stored procedures use.',
 @logging_level=1,
 @days_until_expiration=30,-- set to the number of days you need to keep the history
 @schedule_name=N'CollectorSchedule_Every_30min', -- collector upload schedule
 @collection_set_id=@collection_set_id_15 OUTPUT,
 @collection_set_uid=@collection_set_uid_16 OUTPUT

Select @collection_set_id_15, @collection_set_uid_16

Declare @collector_type_uid_19 uniqueidentifier
Select @collector_type_uid_19 = collector_type_uid
 From [msdb].[dbo].[syscollector_collector_types]
 Where name = N'Generic T-SQL Query Collector Type';

Declare @collection_item_id_20 int
EXEC [msdb].[dbo].[sp_syscollector_create_collection_item]
 @name=N'Stored Procedure Usage Statistics',
 @parameters=N'<ns:TSQLQueryCollector xmlns:ns="DataCollectorType"><Query><Value>
SELECT  d.object_id ,
        d.database_id AS [db_id],
        db_name(d.database_id) AS [db_name],
        OBJECT_NAME(object_id, database_id) AS [sp_name],
        d.last_execution_time,
        d.execution_count
FROM sys.dm_exec_procedure_stats AS d
WHERE d.database_id = DB_ID(''_DemoDB'') </Value>
 <OutputTable>sp_usage_stats</OutputTable></Query>
 <Databases><Database>_DemoDB</Database></Databases></ns:TSQLQueryCollector>',
 @collection_item_id=@collection_item_id_20 OUTPUT,
 @frequency=5,
 @collection_set_id=@collection_set_id_15,
 @collector_type_uid=@collector_type_uid_19
Select @collection_item_id_20

Commit Transaction;
End Try
Begin Catch
Rollback Transaction;
DECLARE @ErrorMessage NVARCHAR(4000);
DECLARE @ErrorSeverity INT;
DECLARE @ErrorState INT;
DECLARE @ErrorNumber INT;
DECLARE @ErrorLine INT;
DECLARE @ErrorProcedure NVARCHAR(200);
SELECT @ErrorLine = ERROR_LINE(),
       @ErrorSeverity = ERROR_SEVERITY(),
       @ErrorState = ERROR_STATE(),
       @ErrorNumber = ERROR_NUMBER(),
       @ErrorMessage = ERROR_MESSAGE(),
       @ErrorProcedure = ISNULL(ERROR_PROCEDURE(), '-');
RAISERROR (14684, @ErrorSeverity, 1 , @ErrorNumber, @ErrorSeverity,
   @ErrorState, @ErrorProcedure, @ErrorLine, @ErrorMessage);

End Catch;

GO
USE msdb;
GO
DECLARE @collection_set INT

select @collection_set = collection_set_id from dbo.syscollector_collection_sets
WHERE name = 'Stored Procedure Usage - "_DemoDB" database'

EXEC sp_syscollector_start_collection_set @collection_set_id = @collection_set;
This will create the following:
- A table in the Management Data Warehouse database (which could be on a different SQL Server). The table will be created under the "custom_snapshots" schema:
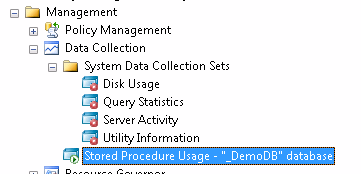
- A data collection set:
Note in the Data Collection Set properties that the data collection mode is cached, the account is "Run as: UtilityAgentProxy") and the data retention is 30 days: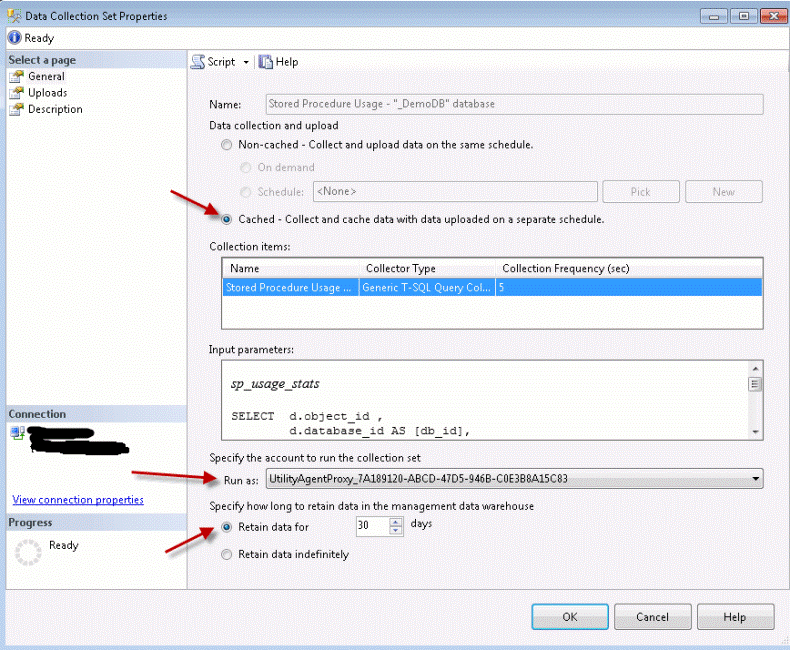
- Two SQL Server Agent jobs (where "10" is the data collection ID):
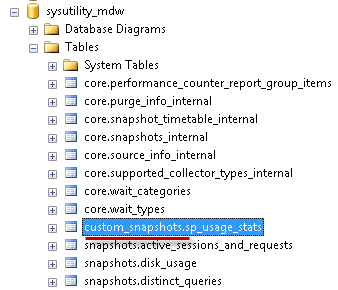
Where the name of the table is from sp_syscollector_create_collection_item stored procedure's parameter (@parameters, OutputTable tag):
...</Value><OutputTable>sp_usage_stats</OutputTable></Query>...
In order to review historical data you will need to query the custom_snapshots.sp_usage_stats table in MDW database:
USE sysutility_mdw
GO
SELECT sp_name,
      max(last_execution_time) as last_execution_time
  FROM custom_snapshots.sp_usage_stats
  GROUP BY sp_name
GO 
The disadvantages of this method:
- MDW is required (follow the steps in this article to configure it in your environment). The database for the MDW can grow very fast.
- Large amounts of data in the sp_usage_stats table (each snapshot will create a separate row) compared to the SQL Server Agent job method.
Using Database Audit to Capture SQL Server Stored Procedure Usage
In SQL Server 2008, the SQL Server Audit feature was introduced. With this option, we can use database-level auditing to monitor the stored procedure executions.
The advantage of this method is that it utilizes the Extended Events feature (which means less load on the server), this method will capture all execution events and also there will be only one record for each execution (much less data compared to the data collector method).
Read this tip about the SQL Server Auditing Feature.
First, we need to create Server Audit object:
USE [master]
GO
CREATE SERVER AUDIT [SrvAudit_sp_execution]
TO FILE
( FILEPATH = N'E:\DBA_Audit'
 ,MAXSIZE = 20 MB
 ,MAX_ROLLOVER_FILES = 50
 ,RESERVE_DISK_SPACE = OFF
)
WITH
( QUEUE_DELAY = 1000  -- equal to 1 second
 ,ON_FAILURE = CONTINUE
)
GO
The Server Audit object is created, but not started:
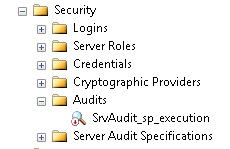
Now we need to create a Database Audit Specification:
USE [_DemoDB]
GO
CREATE DATABASE AUDIT SPECIFICATION [DBAudit_sp_execution]
FOR SERVER AUDIT [SrvAudit_sp_execution]
GO
The Database Audit Specification is created, but not started:
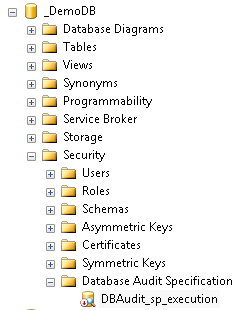
To generate a query for adding all of the stored procedures in the database to the audit we will use the following query:
USE [_DemoDB]
GO
SET NOCOUNT ON
SELECT '
ALTER DATABASE AUDIT SPECIFICATION [DBAudit_sp_execution]
FOR SERVER AUDIT [SrvAudit_sp_execution]
    ADD (EXECUTE ON OBJECT::dbo.'+name+ ' BY [public]) ' FROM sys.objects WHERE type='P'
GO
This is useful when the database has hundreds of stored procedures.
Copy the results and execute it in SQL Server Management Studio:
USE [_DemoDB]
GO
ALTER DATABASE AUDIT SPECIFICATION [DBAudit_sp_execution]
FOR SERVER AUDIT [SrvAudit_sp_execution]
    ADD (EXECUTE ON OBJECT::dbo.proc1 BY [public]) ;

ALTER DATABASE AUDIT SPECIFICATION [DBAudit_sp_execution]
FOR SERVER AUDIT [SrvAudit_sp_execution]
    ADD (EXECUTE ON OBJECT::dbo.proc2 BY [public]) ;
GO
Here is how it looks in the Database Audit Specification now:

Run the following script to enable the Server Audit:
USE [_DemoDB]
GO
ALTER SERVER AUDIT [SrvAudit_sp_execution]
WITH (STATE = ON);
GO
Run the following script to enable the Database Audit Specification:
USE [_DemoDB]
GO
ALTER DATABASE AUDIT SPECIFICATION [DBAudit_sp_execution]
FOR SERVER AUDIT [SrvAudit_sp_execution]
    WITH (STATE = ON);
GO
To view the results you can use 2 methods:
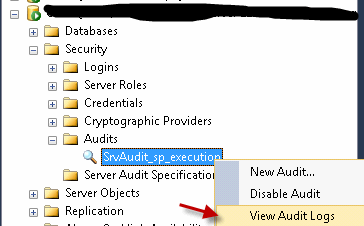
- Right click on Server Audit object and click on "View Audit Log":
- Query the audit files directly to limit the number of columns/rows or to filter by
the stored procedure name:
SELECT MAX(event_time) last_exec_time, [object_name]
FROM sys.fn_get_audit_file
('E:\DBA_Audit\SrvAudit_sp_execution_20898025-...0.sqlaudit',default,default)
 WHERE action_id = 'EX'
 GROUP BY [object_name]
UNION ALL
SELECT MAX(event_time) last_exec_time, [object_name]
FROM sys.fn_get_audit_file
('E:\DBA_Audit\SrvAudit_sp_execution_20898025-...0.sqlaudit',default,default)
 WHERE action_id = 'EX'
 GROUP BY [object_name]
Note: If you monitor the stored procedures execution for a long period of time you may have several audit files. You will need to run a "UNION" query for all these files similar to the query above if you want to use a T-SQL query.

The disadvantages of this method:
- SQL Server Enterprise Edition is required in order to use Database Audit Specification
- Unable to track client host names
- Does not capture new stored procedures executions, you will need to add them to the audit manually after the stored procedure is created
Using Extended Events to Capture SQL Server Stored Procedure Usage
The last method we will explore in this tip for capturing stored procedure execution is using Extended Events. Extended Events were introduced in SQL Server 2008. Read more here about Extended Events.
The advantages of this method:
- Extended Events is a light weight performance monitoring system that has very little impact on the database server
- This is relatively new monitoring system that in the future will replace SQL Server Profiler, so DBAs need to replace trace monitoring with Extended Events.
Create the new event session and start it with the following script (replace "[source_database_id]=(9)" and files locations with your values):
CREATE EVENT SESSION [EXEC_SP] ON SERVER
ADD EVENT sqlserver.sp_statement_completed(SET collect_object_name=(1),
     collect_statement=(0)
    ACTION(sqlserver.client_app_name,
     sqlserver.client_hostname,
     sqlserver.database_id,
     sqlserver.database_name,
     sqlserver.username)
    WHERE (([object_type]=(8272))
     AND ([source_database_id]=(9)))) -- replace with your database ID
 ADD TARGET package0.asynchronous_file_target
  (
    SET FILENAME = N'E:\DBA_Audit\SP_Exec.xel',
    METADATAFILE = N'E:\DBA_Audit\SP_Exec.xem'
  );
GO

ALTER EVENT SESSION [EXEC_SP] ON SERVER
  STATE = START;
GO
To review events data you can run this query:
;WITH ee_data AS
(
  SELECT data = CONVERT(XML, event_data)
    FROM sys.fn_xe_file_target_read_file(
   'E:\DBA_Audit\SP_Exec*.xel',
   'E:\DBA_Audit\SP_Exec*.xem',
   NULL, NULL
 )
),
tab AS
(
 SELECT
  [host] = data.value('(event/action[@name="client_hostname"]/value)[1]','nvarchar(400)'),
  app_name = data.value('(event/action[@name="client_app_name"]/value)[1]','nvarchar(400)'),
  username = data.value('(event/action[@name="username"]/value)[1]','nvarchar(400)'),
  [object_name] = data.value('(event/data[@name="object_name"]/value)[1]','nvarchar(250)'),
  [timestamp] = data.value('(event/@timestamp)[1]','datetime2')
 FROM ee_data
)
SELECT DISTINCT [host], app_name, username, MAX([timestamp]) as last_executed,
  COUNT([object_name]) as number_of_executions, [object_name]
  FROM tab
  GROUP BY [host], app_name, username, [object_name] ;
The results will look similar to this:

Next Steps
- Evaluate each of these options, then select the best method based on your needs to monitor stored procedure executions when you inherit a database or need to tidy up old stored procedures.
About the author
 Svetlana Golovko is a DBA with 13 years of the IT experience (including SQL Server and Oracle) with main focus on performance.
 This author pledges the content of this article is based on professional experience and not AI generated.
View all my tips


