Problem
Database and data security is becoming an ever increasingly more important aspect of what a SQL Server DBA is responsible for. Details of who did or tried to access your database is no doubt something every DBA has had an auditor ask them to provide as a part of a security audit. This tip will look at how you could use SQL Profiler to provide an audit of the login activity on your SQL Server database instance.
Solution
There are many different methods for auditing the logins to your SQL Server instance. You could use the SQL Server Error Log or the newer Extended Events functionality, but for this tip we are going to focus on using SQL Profiler.
Requirements
As with any type of auditing your security team should define some requirements as to what needs to be collected. There is nothing worse than taking the time to set up some type of audit and then find out after the fact that you didn’t have everything they required. For this example we will assume the following audit information is required for both successful and failed login attempts.
- Event
- Event Details
- Username
- Login/Logout Date/Time
- Client Hostname/IP
- Application
- Server Hostname
- Database
Luckily for us SQL Profiler can capture all of the required information above. The following table maps out each requirement to its associated event column in SQL Profiler.
Audit Item | Profiler Item | Description |
|---|---|---|
| Event | Event Class | “Audit Login” and “Audit Login Failed” Events |
| Event Details | TextData | Describes login setting on successful login and error message for failed logins |
| Username | LoginName, NTUsername, NTDomainName | SQL Server login name client used to make connection request. Depending on the type of login (SQL or Windows) all fields may not be populated |
| Login Date/Time | StartTime | Date/time the client login request hit the SQL Server instance |
| Client Hostname/IP | HostName | Server where user login request originated from |
| Application | ApplicationName | Application used by client to try to access database |
| Server Hostname | HostName | Server name that hosts SQL Server instance |
| Database | DatabaseName | Database that user tried to access |
Now that we know what we need to collect in our SQL Profiler session we can go ahead and create our trace. If you’ve read my tutorial on SQL Profiler you have a pretty good idea of how to setup a trace and what each screen is used for so for this tip I’ll just show the completed screenshots.
SQL Server Trace Setup
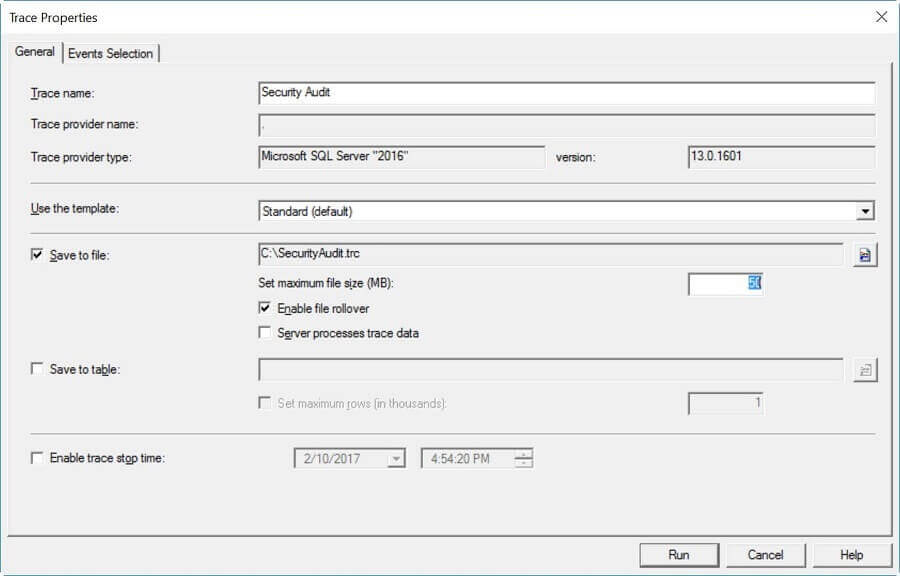
On the “General” tab we will setup the trace to write to a file and have the files rollover every 50MB. Once complete your tab should look like the screenshot below.
On the “Events Selection” tab we can select the events and column data we identified above. On this tab you could also set some filters to exclude any data you don’t require (ie. certain applications or users), but I always capture everything and remove it later if needed. Once done the tab should look like the screenshot below.

All that’s left now is to click “Run” and start collecting data. Data will be populated both in the user interface as well as be saved to the file you configured on the “General” tab. If you plan on using this trace for an extended period of time you can also export the trace definition and then run the SQL script that was generated to have this run as a server side trace. More details on how to do this can be found here.
Next Steps
- Introduction to SQL Server Profiler
- Read more on using the SQL Server error log for auditing
- Use Extended Events to get more Information About Failed SQL Server Login Attempts
- Read more tips on auditing and compliance

Ben Snaidero has been a Database Administrator for just over 10 years. Starting out working mainly with Oracle he got into SQL Server in 2005 and has worked primarily with SQL Server for the last 3 years. His main focus with both Oracle and SQL Server is in the area of performance tuning.
- MSSQLTips Awards: Achiever (75+ tips) – 2018 | Author of the Year Contender – 2016-2017

Can we just add multiple logins for audit in 1 trace ?