Problem
With the release of SQL Server 2016, Analysis Services Tabular introduces a very important new feature: Bi-direction cross-filtering. This feature allows us to support more complex models much easier without the need of creating extra – often complicated – DAX measures. In part 1 of the tip, we introduced how you can set-up many-to-many relationships using bi-directional cross-filters, while in part 2 we discussed dynamic row-level security. In this final part we’ll take a look at implementing measures on top of a dimension and how bi-directional cross-filtering can be of assistance.
Solution
In this tip, we want to achieve the following scenario:

When we are slicing the fact table, we want to see not only the sales amount and how many sales orders we made, but also in how many different subcategories we made sales. Adding measures to a dimension (or even calculated columns) can enrich your data analysis. You can for example categorize your customers according to the sales of the last 12 months or add other means of classification.
We are building on top of the model introduced in part 1 and part 2 (a download link can be found at the end of the tip). The structure is as follows:
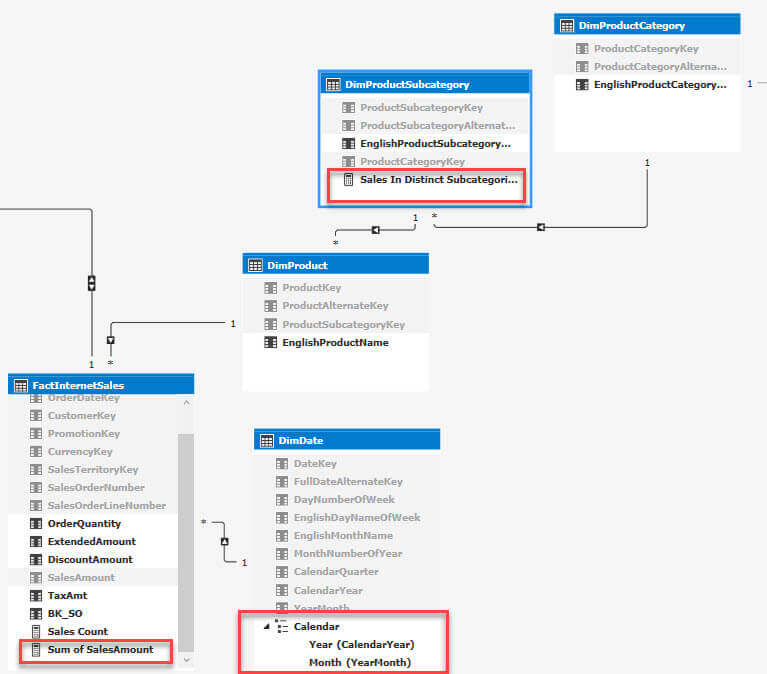
All elements used in the pivot table are indicated in the model. The Sales In Distinct Subcategories measure has the following formula:
Sales In Distinct Subcategories:=DISTINCTCOUNT(DimProductSubcategory[ProductSubcategoryKey])
However, when we take a look at the pivot table, we get the following results:
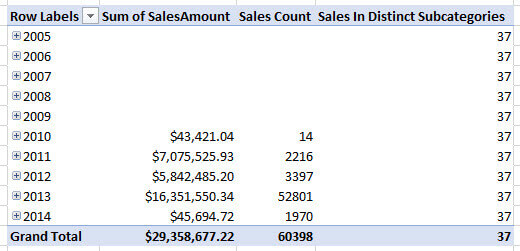
Like in the previous two parts, the measure returns incorrect results – a better choice of words would be unexpected results – because of the nature of relationships in the Tabular model. The following screenshot displays how the filters flow in the model:

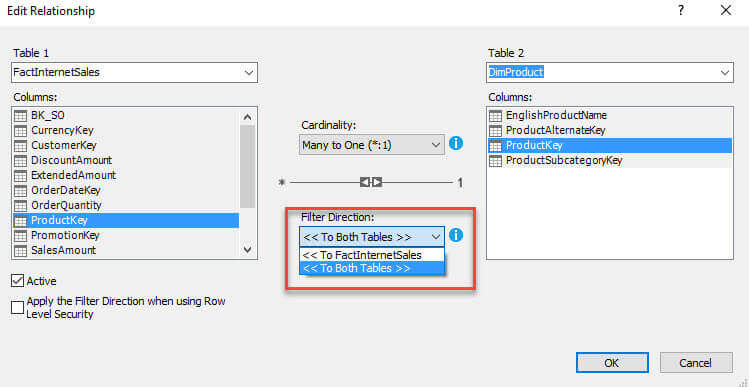
The red arrows indicate how the filters currently flow. In the pivot table, each row is a separate instance of the Year member of the Calendar hierarchy. A specific year filters the fact table: only the sales for that year are shown. However, this doesn’t filter the product or product subcategory table, since the filters flow in the opposite direction. Solving our issue is done by – as you might guess – setting certain relationships to bi-directional. To be precise, the relationships indicated with a green arrow in the previous screenshot. A work around would be to include the subcategory key into the fact table, which you can achieve by using the RELATED function in a calculated column. This adds additional overhead to the model and it might bloat the model with extra columns which can be avoided. Remember, the model has to fit into memory. So let’s configure the relationships to be bi-directional:
If we refresh the pivot table we get the expected result:
Keep in mind that enabling bi-directional cross-filtering has consequences as well. For example, if you have a report sliced on the year 2015, you will only see products and product subcategories who were actually sold in that year. If those dimensions are connected to other fact tables, this will influence your numbers. Only enable bi-directional cross-filtering when you absolutely need it (for example with many-to-many relationships scenarios) and if you are sure it doesn’t have undesired consequences.
Conclusion
In this tip, we have shown how the bi-directional cross-filtering feature of Analysis Services Tabular 2016 allows us to create a richer data analysis by creating measures on top of our dimensions. Enabling bi-directional filtering should however be done carefully, as it can ripple through your model and filter out rows you might actually want to keep.
Next Steps
- If you want to check out the Tabular model shown in the tip, you can download it here. Make sure to change the connection strings to the source data.
- Check out part 1 and part 2 of this tip to learn about other scenarios for bi-directional cross-filtering.
- You can find more Analysis Services tips in this overview.
- For more SQL Server 2016 tips, you can use this overview.

Koen Verbeeck is a seasoned business intelligence consultant with over a decade of experience with the Microsoft Data Platform. He holds several certifications, including Azure Data Engineer. He’s a prolific writer, with over 375 articles on technologies such as Microsoft Fabric, SSIS, ADF, SSAS, SSRS, MDS, Power BI, Snowflake and Azure services. He has spoken at various events such as PASS, SQLBits, dataMinds Connect and many others. He frequently delivers educational webinars on MSSQLTips.com. For his efforts, Koen has been awarded the Microsoft MVP data platform award for many years.
- MSSQLTips Awards:
- Leadership Award (200+ Tips) – 2021
- Author of the Year – 2014/2020/2022
- Author Contender – 2024/2025