Problem
I have a large Tabular model created in Analysis Services 2016. In most tables I have many different measures or columns and it’s becoming really hard for the users to navigate the model. Is there any way I can group objects together?
Solution
Analysis Services Multidimensional has the solution to this problem for years: display folders. You can assign measures or dimensions attributes to a specific folder which makes browsing the model more user friendly. An example from the AdventureWorks sample cube:

Analysis Services Tabular 2012/2014 didn’t officially support these display folders. However, you could add them by either manipulating the XMLA code of the model directly.
Luckily Analysis Services 2016 now officially supports display folders, which mean you can configure them easily through the Visual Studio (SQL Server Data Tools) interface. In this tip, we’ll give an overview of this new feature.
Setting the Display Folder
Let’s set the display folder for some measures in the WideWorldImporters Tabular model (see the tip Using Calculated Tables in Analysis Services Tabular 2016 for Aggregate Tables – Part 3 for more info). When you select one or more columns, you can set the Display Folder in the property pane:

Setting the display folder for a measure is exactly the same. When we browse the model with Excel, we can find the display folder listed under the table node:

Unlike SSAS Multidimensional, there is no dropdown with existing display folders; you have to type everything manually (or copy and paste of course).
Assigning Multiple Display Folders
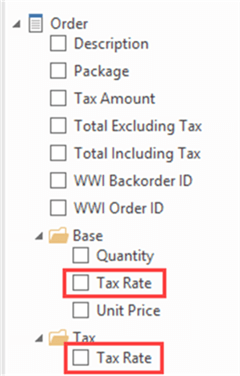
It is possible to assign one single measure or column to multiple display folders. You can do this by concatenating them using the semicolon. Let’s put the Tax Rate column in two display folders:

This gives the following result in Excel:
It might be a bit confusing though if the same measures pops up multiple times in the field list.
Nesting Display Folders
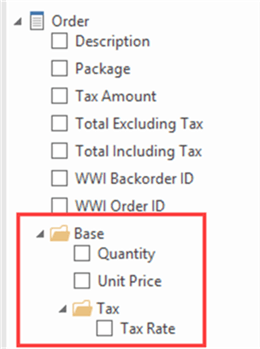
A bit more interesting scenario is the ability to nest display folders. This is done by concatenating the display folders with a backslash. Instead of putting the Tax Rate in two distinct display folders, let’s nest them instead:

Which gives:
Behavior in Different Client Tools
Excel
Excel supports display folders as you have noticed previously. However, it will display them in different places depending if the items in the display folder are measures or columns. For example, if some measures are added to a display folder called “Derived Measures”, we get the following:

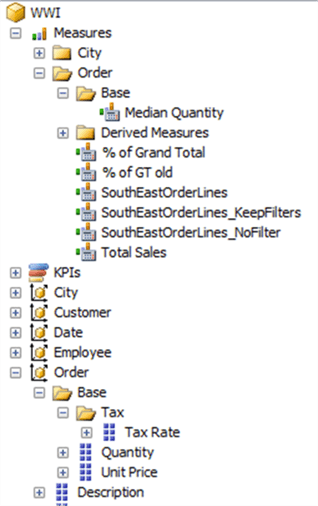
SSAS Tabular
The display folder is moved to the “Order measure group”, although there’s no such concept in SSAS Tabular. If a display folder contains mixed objects – measures and columns- it will be repeated twice in the field list. The same is true for the browser in SQL Server Management Studio (since that one is still complete based on the Multidimensional layout):
Power BI Desktop
This screenshot was taken with version 17.2 of SSMS. Power BI Desktop however gladly mixes measures and columns together in its display folders:

Reporting Services Query Designer
The Reporting Services Query Designer behaves the same way as Excel and SSMS:

Notice that while the query editor can produce DAX queries (available in the latest version of SSDT), the field list still displays all objects as if we’re dealing with a multidimensional model.
Conclusion
Display folders are nice addition to Analysis Services Tabular 2016 models. They allow you to easily create more structure in your models. It is possible to put objects in multiple display folders or to nest display folders. Depending on the client tool, display folders behave a bit differently for measures.
Next Steps
- For all of the new features in Analysis Services 2016, check out What’s new in SSAS 2016 part 1 and part 2.
- You can find more Analysis Services tips in this overview.
- For more SQL Server 2016 tips, you can use this overview.

Koen Verbeeck is a seasoned business intelligence consultant with over a decade of experience with the Microsoft Data Platform. He holds several certifications, including Azure Data Engineer. He’s a prolific writer, with over 375 articles on technologies such as Microsoft Fabric, SSIS, ADF, SSAS, SSRS, MDS, Power BI, Snowflake and Azure services. He has spoken at various events such as PASS, SQLBits, dataMinds Connect and many others. He frequently delivers educational webinars on MSSQLTips.com. For his efforts, Koen has been awarded the Microsoft MVP data platform award for many years.
- MSSQLTips Awards:
- Leadership Award (200+ Tips) – 2021
- Author of the Year – 2014/2020/2022
- Author Contender – 2024/2025