Problem
I have created a data model in Analysis Services. This model contains a couple of hierarchies. One of those hierarchies is a ragged hierarchy, which means not all branches of the hierarchy tree have the same number of levels. Right now, if a branch stops, the leaf member is repeated until the lowest level. How can I model this correctly in Analysis Services?
Solution
In the tip How To Handle a Parent-Child Relationship in Analysis Services Tabular, an example is given of a ragged hierarchy in the format of a parent-child hierarchy:
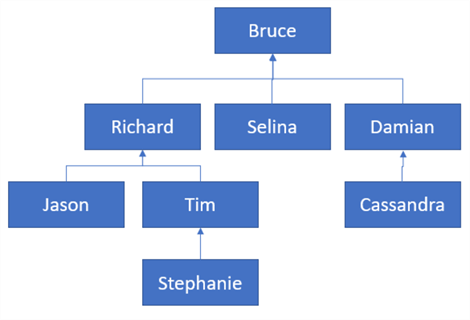
Here, a branch can stop before the lowest level is reached (e.g. Selina and Jason are examples of such leaf nodes). When modeled as a normal hierarchy, we get the following hierarchy:
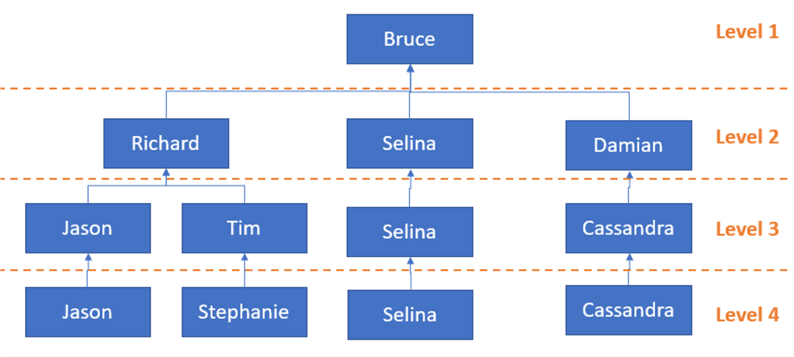
However, having repeating members can be confusing to end users. Since it’s not possible in Analysis Services (SSAS) Tabular to model a hierarchy as a true parent-child relationship, we need to maintain the structure of a normal hierarchy. The solution would be to hide the repeating members.

In this tip, we’ll explore how we can achieve this in SSAS Multidimensional and Tabular.
Creating a Ragged Hierarchy in SSAS Multidimensional
Test Set-up
We will use the AdventureWorksDW2017 sample database, which can be downloaded here. First, create a new SSAS Multidimensional project in your Visual Studio of choice. The next step is to create a data source connecting the project to the sample database.

Then we create a data source view. For our ragged hierarchy example we only need two tables: DimSalesTerritory and FactResellerSales.

Normally a relationship between the two tables is created automatically. If not, create one.

Let’s start with the Sales Territory dimension. Launch the New Dimension wizard. Choose to use an existing table in the first step. Choose the Sales Territory table and configure the SalesTerritoryKey column as the key column and the SalesTerritoryRegion column as the name column.

In the next step, also include the Sales Territory Country and Group columns.

In the dimension editor, create the following hierarchy:

To make it a proper natural hierarchy, we create the following attribute relationships:

Now it’s time to process the newly created dimension with a Process Full (make sure you have set the appropriate permissions to read from the source database). The hierarchy should look like this in the browser:

As you can see, for most countries, the sales territory and the country level are the same, with the exception of the United States.
Let’s create the cube for the reseller sales fact table. Start the Cube wizard and choose to use an existing table. Choose the FactResellerSales table as the measure group table.

To keep it simple, only check the Sales Amount measure.

Choose to include the Sales Territory dimension we created earlier.

However, do not create the suggested dimension based on the fact table itself.

Rename the cube to Reseller Sales and finish the wizard.

Perform a Process Full on the cube and check the results in the browser.
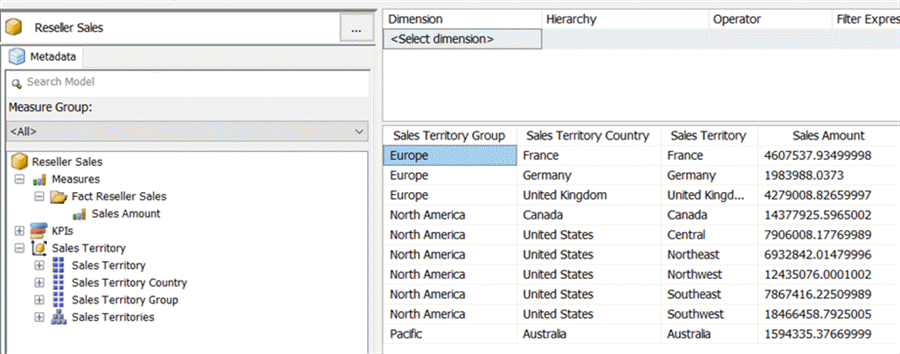
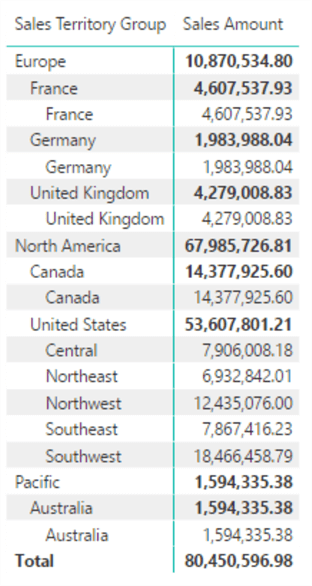
Again we can verify certain members being repeated throughout the hierarchy, such as Australia. In Excel we get the following view:
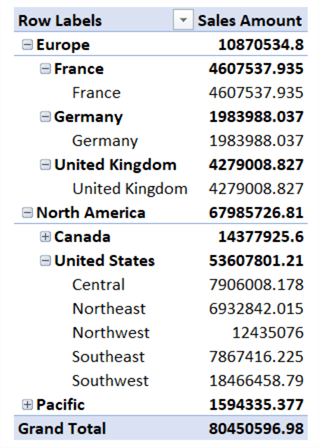
Here the problem of the repeating members stand out more, as the same number for Sales Amount is repeated which can lead to confusion.
Configuring Ragged Hierarchy Properties
The solution is quite simple. On each level of the hierarchy, we can set a property called HideMemberIf. It can have the following settings:
- Never - the level member is never hidden.
- OnlyChildWithNoName - if the member is the only child of the parent and the member value is null or empty, it is hidden.
- OnlyChildWithParentName - the same as the previous option, but this time the name is equal to the name of the parent.
- NoName - hide the member if the name is empty.
- ParentName - hide the member if the name is the same as the name of the parent.
In our example here we have repeating members so we can choose between ParentName or OnlyChildWithParentName. When would you choose for one or the other? For example, in Belgium we have the province Antwerpen, but there’s also a city called Antwerpen. If we want to avoid that the city member gets hidden because it has the same name as the province, we need to choose the OnlyChildWithParentName since there are other children as well (the other cities in the province). In the sales territories example, we can choose the ParentName option.

Reprocessing the dimension with a Process Update yields the following result in Excel:

For most countries, the hierarchy now stops at the country level.
Side note: this works in Excel because the way the hierarchy is build. For client tools to display the ragged hierarchy properly, the property MDX Compatibility must be set to 2 in the connection string to the cube. However, Excel hardcodes this property to 1. In certain cases this doesn’t pose a problem though. You can find more information about this behavior in Working with Ragged Hierarchies and the blog post Ragged Hierarchies, HideMemberIf and MDX Compatibility by Chris Webb. Power BI Desktop doesn’t display the ragged hierarchy correctly:
Creating a Ragged Hierarchy in SSAS Tabular
We will use the solution build in the tip How To Handle a Parent-Child Relationship in Analysis Services Tabular. On the EmployeeOrganization hierarchy, we have a similar setting as in SSAS Multidimensional:

This setting was introduced in the 1400 compatibility level for SSAS Tabular, which corresponds with SSAS 2017 and Azure Analysis Services. In Tabular however, there are only two possible configurations:
- Default - which means do nothing. This corresponds with the Never setting in SSAS Multidimensional.
- Hide blank members - this corresponds with the NoName setting in SSAS Multidimensional.
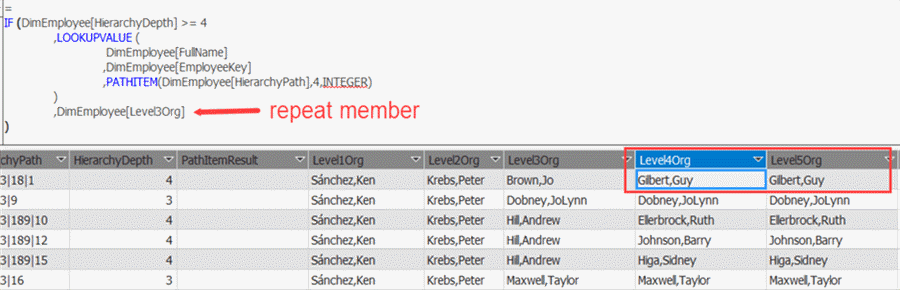
In our set-up however, we have repeating members instead of blank members:
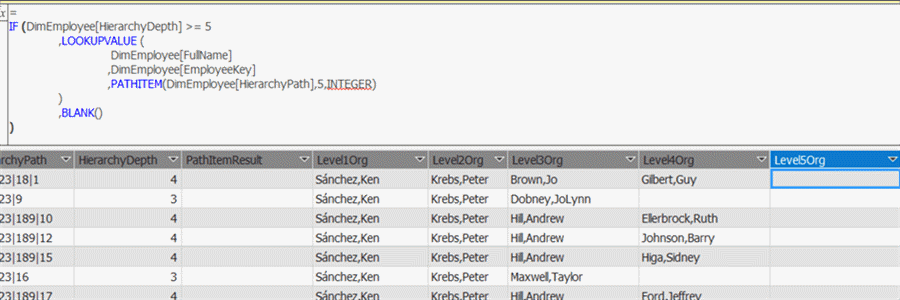
We can change this by slightly modifying the calculated column formulas; instead of selecting the value of the previous value, we just return BLANK().
With the changed calculated columns (which are the levels of the hierarchy) and the Hide Members property set to Hide Blank Members, we get the following results in Excel:

However, at the time of writing, Power BI Desktop also doesn’t support ragged hierarchies from a Tabular model:

Because of all the blanks in the hierarchy, the visualization looks confusing.
Conclusion
In this tip we have shown how you can create ragged hierarchies in both Analysis Services Multidimensional and Tabular. In both cases, a hide member property needed to be configured. This solution works great in Excel, but at the moment, Power BI Desktop doesn’t support them.
Next Steps
- Read the tip How To Handle a Parent-Child Relationship in Analysis Services Tabular to find out how you can model a parent-child relationship in SSAS Tabular. In combination with the hiding of blank members, it comes real close to having an actual parent-child relationship.
- You can download the SSAS Multidimensional solution here. It was created with Visual Studio 2017 (SSDT version 15.4) but SSAS Multidimensional should support backwards compatibility.
- You can find more Analysis Services tips in this overview.

Koen Verbeeck is a seasoned business intelligence consultant with over a decade of experience with the Microsoft Data Platform. He holds several certifications, including Azure Data Engineer. He’s a prolific writer, with over 375 articles on technologies such as Microsoft Fabric, SSIS, ADF, SSAS, SSRS, MDS, Power BI, Snowflake and Azure services. He has spoken at various events such as PASS, SQLBits, dataMinds Connect and many others. He frequently delivers educational webinars on MSSQLTips.com. For his efforts, Koen has been awarded the Microsoft MVP data platform award for many years.
- MSSQLTips Awards:
- Leadership Award (200+ Tips) – 2021
- Author of the Year – 2014/2020/2022
- Author Contender – 2024/2025