Problem
I have a PivotTable in Excel where I show users data from an Analysis Services Tabular 2017 model. The PivotTable shows aggregated data and users were wondering how the data was calculated. I’m looking for behavior like a drillthrough report in Reporting Services. Is this possible?
Solution
Let’s illustrate the problem with an example. Suppose we have the following PivotTable in Excel:
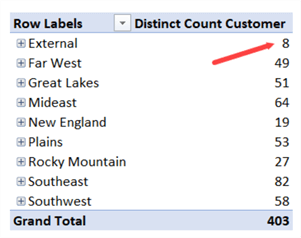
Users are wondering who exactly those 8 customers are from the External region. You can either add extra fields to the PivotTable with more descriptive information about the customers, but this severely changes the layout of the PivotTable and it might not contribute to the original analysis. Another option is to double-click on the cell containing the number 8 or right-clicking the cell and choosing Show Details.

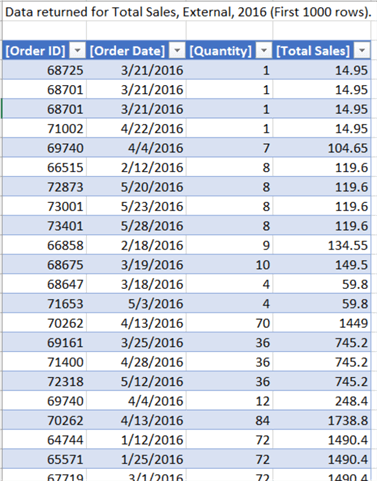
This will open a new worksheet in Excel that will retrieve the first 1,000 rows that contribute to this number. In our case, it’s all the columns of the Customers table for those 8 customers:

The problem with this default drillthrough is all columns are returned – even the Customer Key although it is hidden from client tools in the Tabular model – and they have quite unfriendly column names. The columns are also returned in the order as they are defined in the model. We would like a more granular control over which data is returned by the drillthrough. Luckily this is what the new compatibility level 1400 of SQL Server Analysis Services 2017 (SSAS) gives us: full control.
Test Set-up
In this tip, we’ll use a Tabular model built open the WideWorldImporters data warehouse sample database. You can find more information on how to install the sample database in the tip Install SQL Server 2016 Sample Database: Wide World Importers Data Warehouse and you can download the Tabular model here.
The Detail Rows Property in SSAS 2017
The solution comes in the format of a property you can set on individual measures or on tables: the Detail Rows Expression.
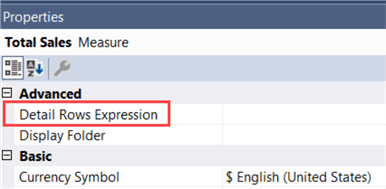
With this property you can define a DAX query that will be executed whenever a drillthrough is requested. You can define one for every measure, or you can define a default Details Rows expression on the table. This default expression will be used for all measures that don’t have the property set.
Let’s define a detail rows expression for the Total Sales measure in the Order table. Clicking on the ellipsis for the property will open up a DAX editor. With the SELECTCOLUMNS function we can specify the columns we want to retrieve and change the column names as well:

By using the RELATED function, we can also retrieve columns from other tables, as long as there’s a relationship between the tables. Let’s also define a similar expression for the Order table:

Let’s try this in Excel. We have the following PivotTable:

We are interested in more details for the External territories for the year 2016. Double-clicking on the cell opens the following sheet:
Keep in mind the detail rows expression can return many rows when it is executed on a low grain of the data. Excel will show only the first 1,000 rows, but at the server the whole expression is evaluated. If you have a very large fact table, this can have a considerable performance impact, especially if context transitions are used in the DAX expression.
Let’s test the default detail rows expression on the Order table by switching the Total Sales measure with the OrderCount measure:

Double-clicking on a cell now gives the following drillthrough:

The DetailRows Function
To accompany the new Detail Rows property, there’s also a new function in DAX: DETAILROWS (there’s no documentation page yet at the time of writing). This function allows you to retrieve the row set defined by the Detail Rows expression, which is similar to the DRILLTHROUGH statement in MDX. Since it returns a table, you can use it in any DAX function that expects a table as parameter.
An example of the function to retrieve the details for the Order table:

If we evaluate this function for a measure which doesn’t have the detail rows property set and there’s no default specified for the parent table, the whole table is returned:

Do not try this at home (or at your production server) for very large tables.
Drillthrough in Other Tools
The Detail Rows property is supported very well in Excel, but what about other tools? In Reporting Services, the ability to create drillthrough reports has always been there. You specify an action on a report item and you configure the action to go to another report, with the ability to pass along parameter values. You can either specify a whole new DAX query, or use the DETAILROWS function. You can learn more about SSRS drillthrough reports in the tip SQL Server Reporting Services 2012 Drilldown Features.
In Power BI Desktop, you can mimic the behavior of drillthrough reports using the bookmarks feature. You can also use the DETAILROWS function in the query editor along with parameters, as explained in the blog post Query Detail Rows In Power BI.
Analysis Services Multidimensional has a similar feature as the Detail Rows expression: the drillthrough action. It also allows you to specify which columns are returned when you request a drillthrough on a cell. But it’s hard to control the order of the columns and their column names. In Tabular you have absolute freedom over the query that returns the table. You can learn more about the feature in the tip Enabling Drillthrough in Analysis Services.
Conclusion
With the new Detail Rows Expression property and the DETAILROWS function we have full control over the drillthrough experience in Analysis Services Tabular 2017. This new functionality is available in the 1400 compatibility level.
Next Steps
- If you want to try it out yourself, you can download the Tabular model used in this tip.
- Marco Russo has an extensive write-up about detail rows expressions: Controlling drillthrough using Detail Rows Expressions in DAX
- More tips about drillthrough: SQL Server Reporting Services Drill Through Tips
- You can find more Analysis Services tips in this overview.

Koen Verbeeck is a seasoned business intelligence consultant with over a decade of experience with the Microsoft Data Platform. He holds several certifications, including Azure Data Engineer. He’s a prolific writer, with over 375 articles on technologies such as Microsoft Fabric, SSIS, ADF, SSAS, SSRS, MDS, Power BI, Snowflake and Azure services. He has spoken at various events such as PASS, SQLBits, dataMinds Connect and many others. He frequently delivers educational webinars on MSSQLTips.com. For his efforts, Koen has been awarded the Microsoft MVP data platform award for many years.
- MSSQLTips Awards:
- Leadership Award (200+ Tips) – 2021
- Author of the Year – 2014/2020/2022
- Author Contender – 2024/2025