By: Scott Murray | Comments (2) | Related: > SQL Operations Studio
Problem
What are some of the unique features in the new tool SQL Operations Studio tool?
Solution
Microsoft has developed a new tool for SQL Server called SQL Operations Studio. I am going to call it SOS for short, and I think that acronym is appropriate as it helps with managing SQL Server. Also, you will need to remember that the current iteration of the product is in the very early stages of its lifecycle (Preview mode) and in fact Microsoft could even discontinue it at some point (I do not think so though). You may certainly notice the name selected for this new tool: SQL Operations Studio. Its path is directly related to the DevOps movement and designing a tool that is focused on the DevOps areas of organizations.
For this particular tip, we are going to focus on a few areas that standout on the feature list:
- Integrated Terminal Window
- User Settings
- Custom Widgets for Dashboards
Of course our first step is to download Microsoft's SQL Operations Studio at: https://docs.microsoft.com/en-us/sql/sql-operations-studio/download. I would recommend taking a look at Rajendra Gupta’s tip on the install process.
On the download site, a few items may pop out as being unusual from the start. SQL Operations Studio, SOS, can be installed on multiple operating systems including, of course, Windows, and then MAC and Linux. The specific list of supported OS’s includes Windows 7, 8, & 10, Windows Server 2008-2016, MacOS 10.12 & 10.13, and Redhat 7.3 & 7.4 (enterprise), Suse Linux v12SP2, and Ubuntu 16.04. Certainly, be on the lookout for changes to this list, which should generally be shown on the download page. Once SOS is downloaded, the install process on a Windows based system follows the standard “next, next, next, etc.” install. Now we are ready to start exploring this new tool.
Using SQL Operations Studio
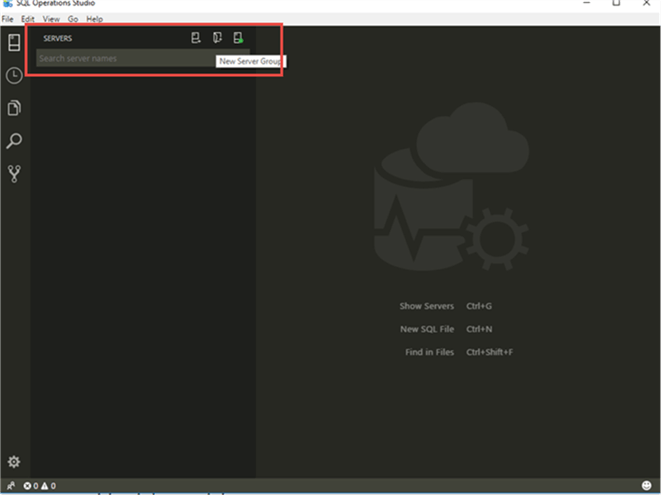
As shown below, the display area for the tool is very basic and focuses on keyboard-based commands for quick ease of use. The first step in the process is to setup a new connection. Just to the right of the Server heading we have three buttons, the left of which is the Add Connection button.
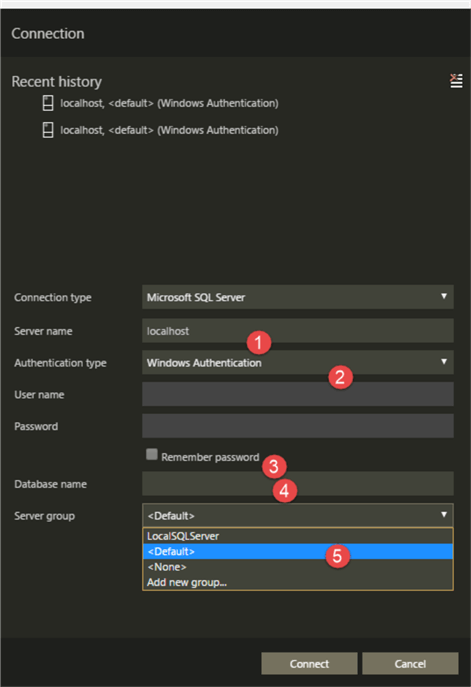
For the connection, the server name and the authentication details must be completed. The database name is optional as is the Server Group. The Server Group allows you to group similar servers into category groups.
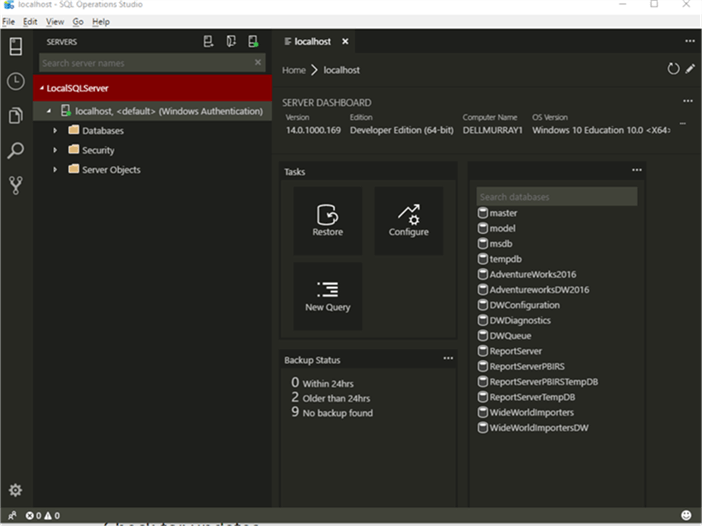
After hitting connect, the Server Dashboard is displayed with several widgets.
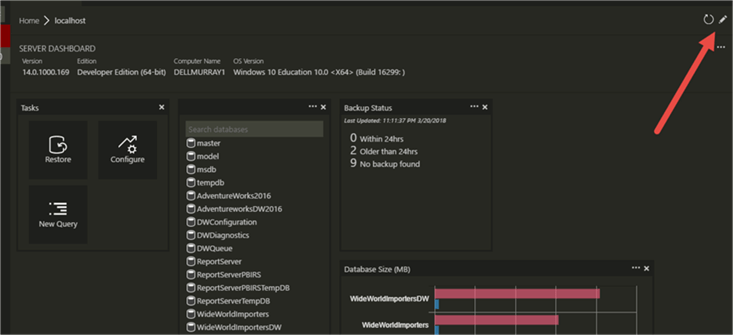
Each of these widgets is portable and can be moved around the main body of SOS by clicking on the edit button, as shown below.
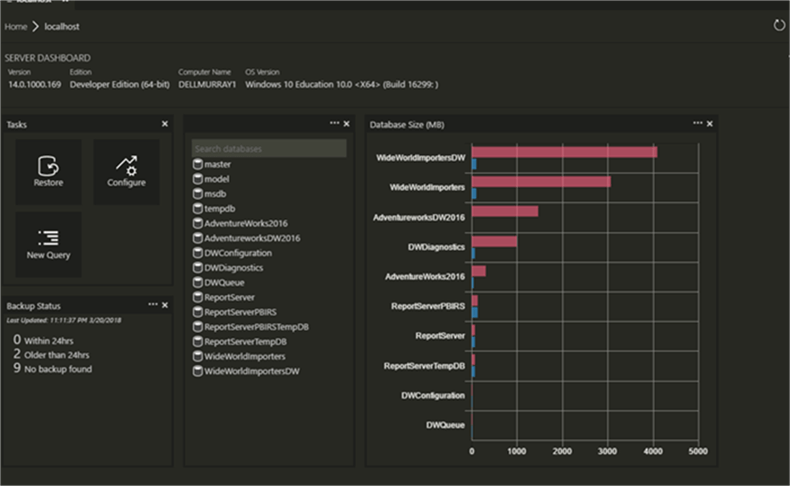
This setup also allows for SOS to be extensible with the addition of other widgets to compliment the existing widgets. Furthermore, because of it is .Net base and uses microservice architecture along with the SQL Server Tool Service (https://github.com/Microsoft/sqltoolsservice), the overall setup of the application is designed for customization and additional functionality.
SQL Operations Studio Integrated Terminal Window
One of the very neat features of the tool, is the integration with various command line tools. Simply selecting View and Integrated Terminal opens the command editor.
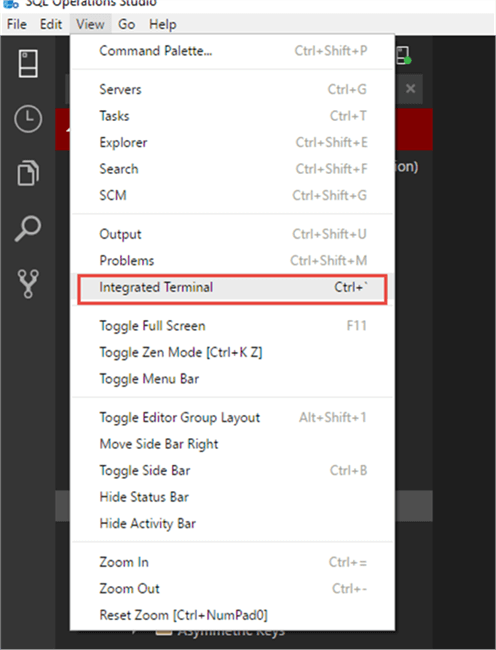
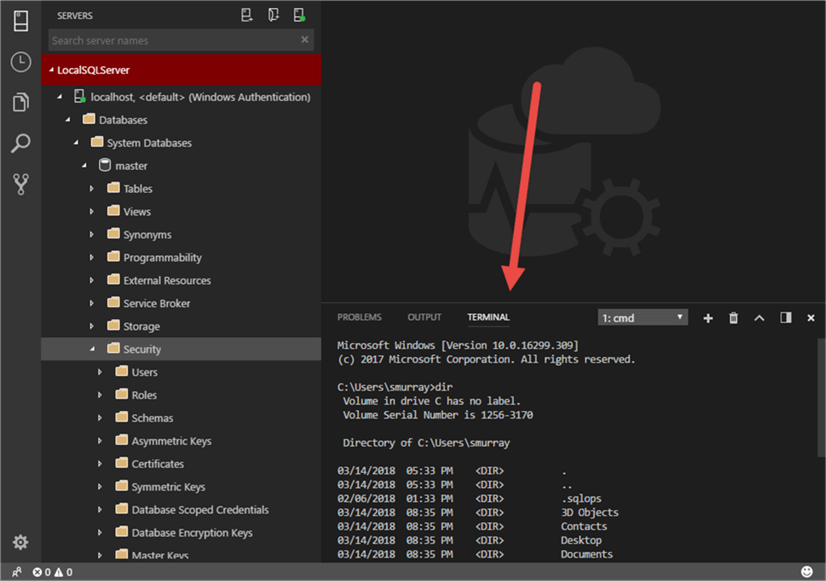
In this case, we can execute commands without having to leave the tool. In the below example, we are using the DOS command line, but depending on your operating system, you can also execute PowerShell (Windows) or Bash (Mac / Linux).
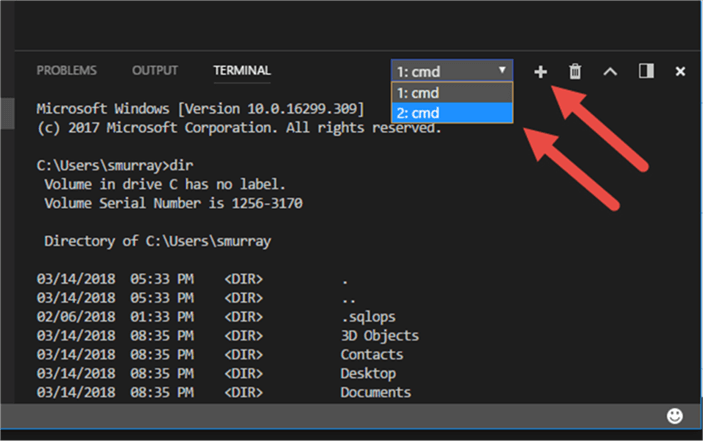
As needed and as shown below, multiple terminal sessions can be running at the same time. Furthermore, using the plus button adds additional sessions whereas the trash can button removes a session.
If PowerShell is the preferred tool for the command line, then the settings can be changed to reflect PowerShell as the default tool. First the settings must be opened via the preference option on the File Menu.
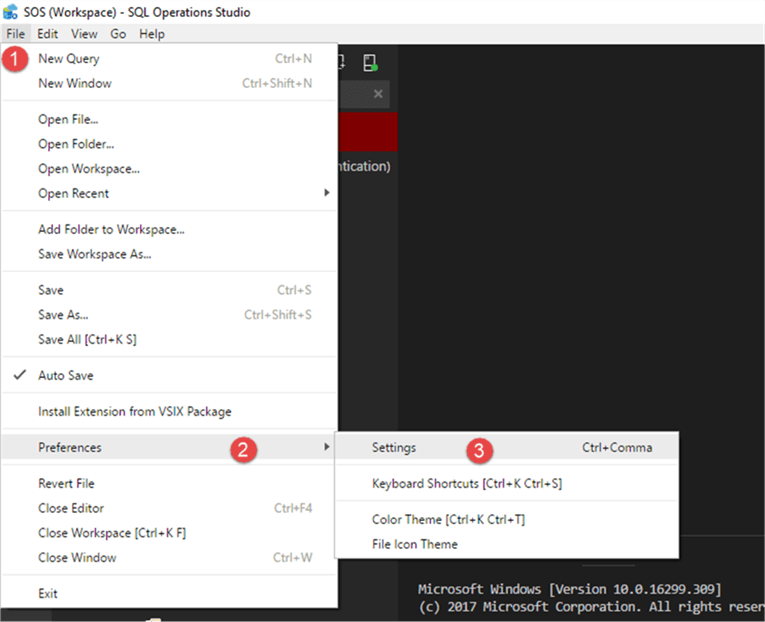
Next, we need to set the terminal.integrated.shell.windows element to the location of the PowerShell exe.

Now, when a new integrated terminal session is opened, PowerShell will be used.

SQL Operations Studio User Settings
You may have noticed in the above example that the settings area is actually a json file with various elements and line items that allow you to change each item manually. With the tool designed to be light weight and flexible, these settings allow for detailed control of your SOS tool. Furthermore, on the left side of the settings area, under Default Settings, you will find the default settings and commonly used options for many of the settings. To make changes you will want to adjust the value in the right-side pane.
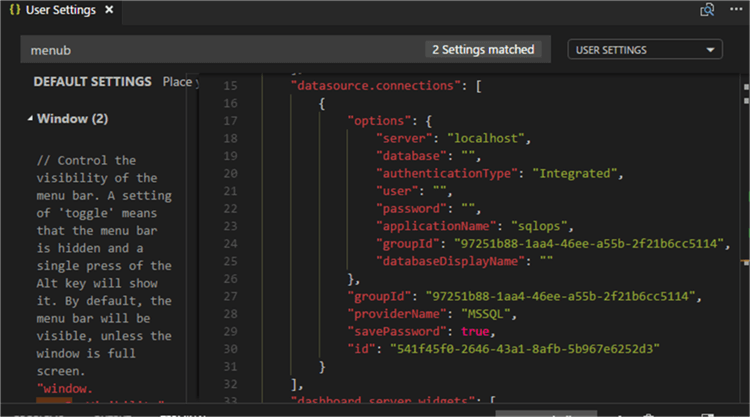
Additionally, settings can be set at two levels, either the user level or workspace level. The workspace scope settings are the primary and override any user settings which may be set.

Finally, you can easily share your settings.json file, commonly located in %APPDATA%\sqlops\User on Windows, with your coworkers or on other machines which makes setup much easier. Just copy the file from one machine to another.
In the event you do something “crazy” with the user settings, you always have the default values to fall back on. In fact, there is a quick way to copy the default setting back to your users setting if needed. In the below example, I changed the editor.tabsize setting for the user to 25. As you can see in the left panel, the default is 4.
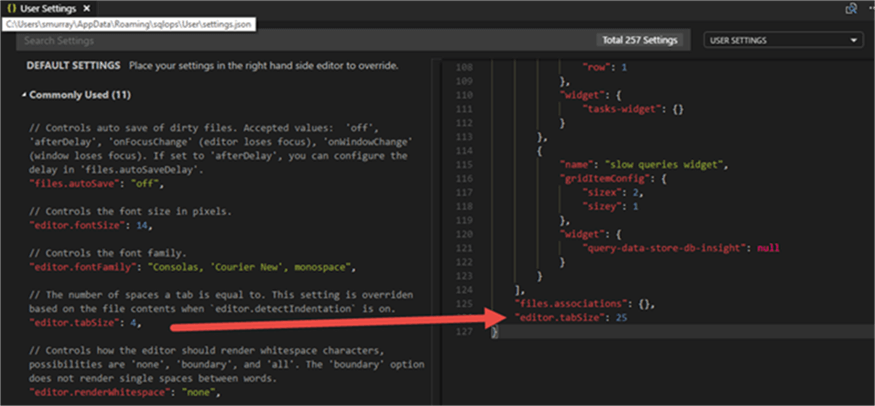
Simply hovering over the editor.tabsize option, then clicking on the pencil edit button, you are given the option to Replace in Settings.
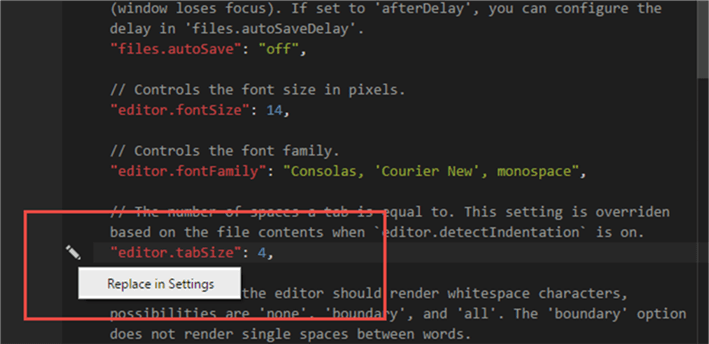
Selecting this option overwrites the current user setting.

Of course, care must be taken with these options, as you could easily overwrite other options that you would prefer to not be changed.
SQL Operations Studio Custom Dashboard Widgets
In a way similar to Power BI Customizations, SOS also provides the ability to add custom widgets to server and database dashboards.
Our first step in the widget creation process is to create a query that will be used as a basis for the widget. In the below example, the average, minimum, and maximum backup times, in seconds, are recorded for each database. Once you are satisfied with the query, be sure to save it.
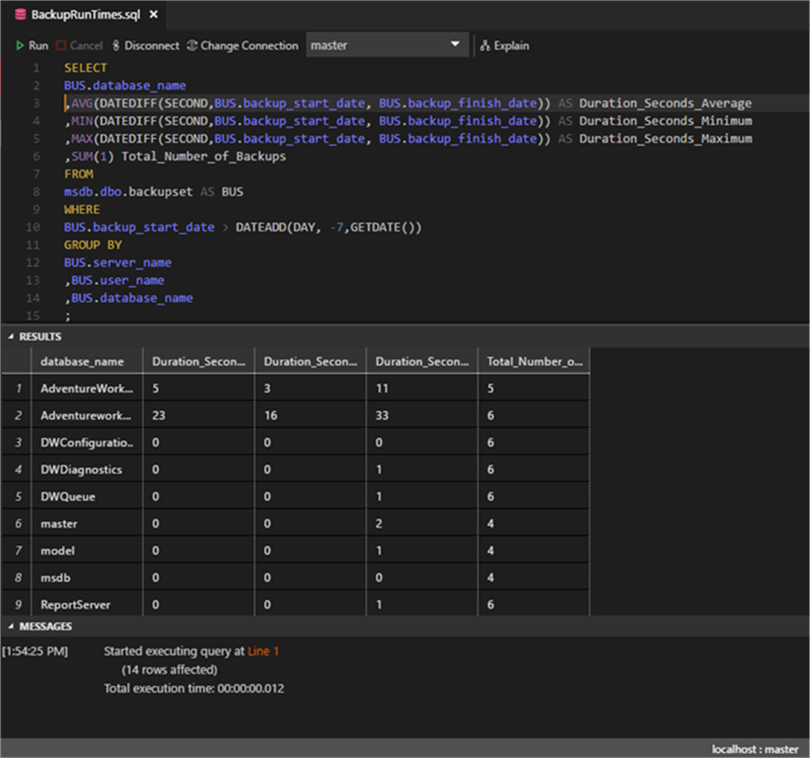
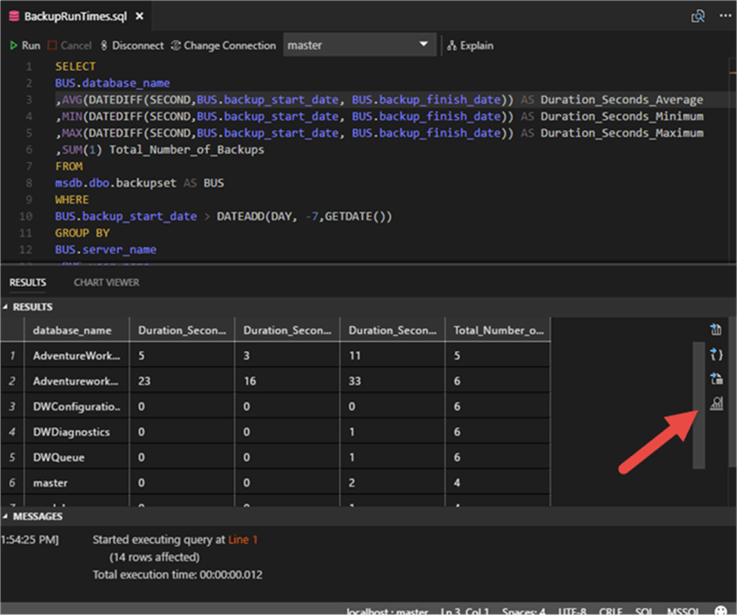
Next, we to see the results in chart format by clicking on the View as Chart button.
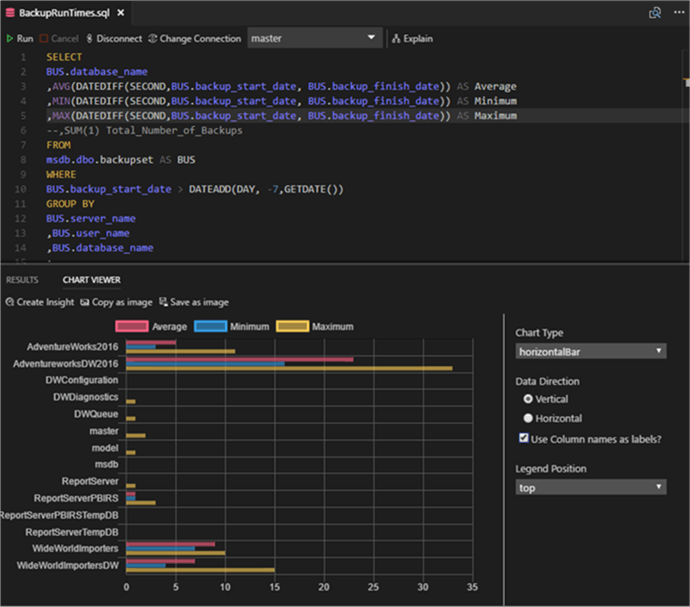
Here is a copy of the chart results. For each database, we have the Average, Minimum, and Maximum duration time in seconds.
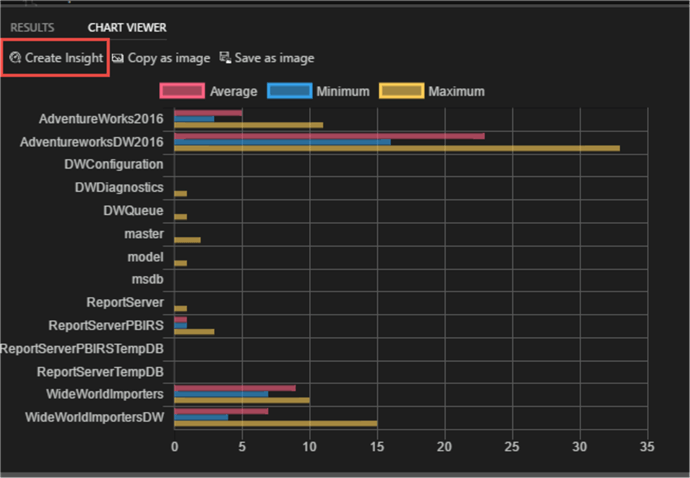
The next step is to click on the Create Insight option in the chart results.
SOS creates the JSON details for the widget.
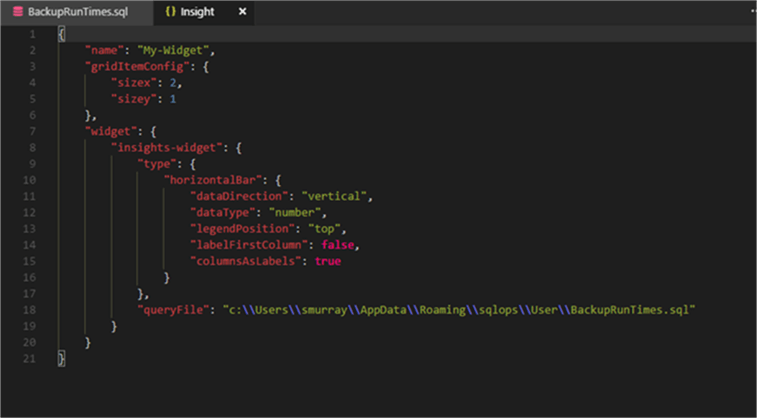
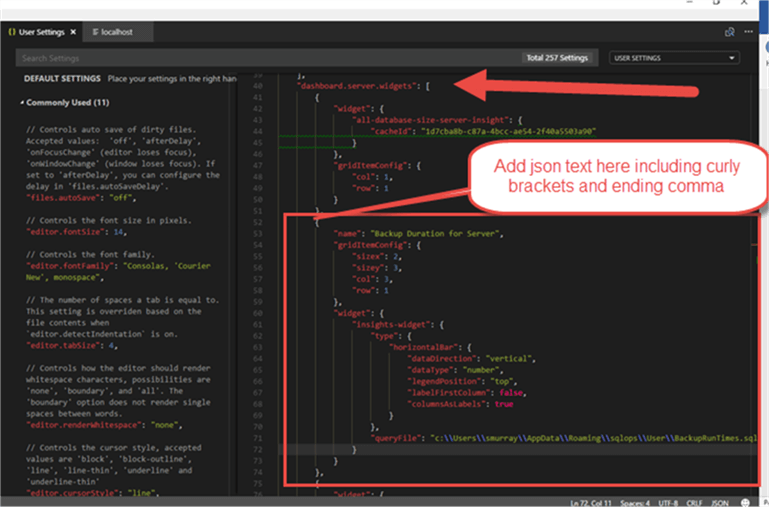
This text must then be copied into the user settings; specifically, it is added as one of the elements under the dashboard.server.widget section. Once added, the setting will need to be saved (ctrl + s is the keyboard equivalent).
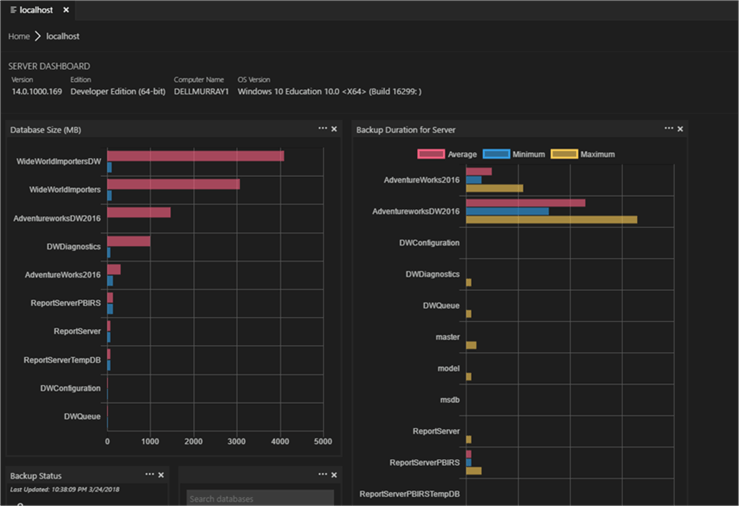
Now, the custom wizard has been added to the server dashboard. It can be resized or moved within the dashboard very easily.
The new Microsoft SQL Operations Studio tool, SOS, is a great addition to the SQL Server tool set. Although only in beta or preview mode, it is quickly achieving value for DBAs, developers, and other database support personnel.
Next Steps
- Check out the following resources:
About the author
 Scott Murray has a passion for crafting BI Solutions with SharePoint, SSAS, OLAP and SSRS.
This author pledges the content of this article is based on professional experience and not AI generated.
View all my tips


