Problem
In my previous tips SQL Operations Studio Installation and Overview, SQL Operations Studio – Query Editor and Source Control and Customizing Dashboards in SQL Operations Studio, we learned about the new tool SQL Operations Studio and some of its features. In this tip, we will see how to create custom widgets along with different extensions.
Solution
Graphical representation of data helps visualize data quickly and effectively. SQL Operations Studio widgets represent data in graphical formats to visualize data. SQL Operations Studio provides some useful built-in widgets like:
- Table-space-DB-insight
- Query-data-store-DB-insight
- Backup-history-server-insight
- All-database-size-server-insight
Apart from the built-in widgets, we can also create custom insight widgets using a T-SQL script. Let’s explore how to create and configure a custom insight widget.
Add a custom database insight widget to the SQL Operations Studio dashboard
Custom insight widgets can be the following:
- Insight widget: The widget that appears in the dashboard, this widget uses a T-SQL query to return the data in the widget. This is mandatory to configure the widget.
- Insight widget details: If we want to view further details about the data, we need to configure using the insight widget details page query.
First, we have to configure the insight widget query in SQL Operations Studio. When we open up the dashboard page, it executes the saved query in the background and displays the results as per the configuration as a chart, text, image, etc. We can also configure the details page to provide additional details when required.
In my demonstration, I will be using the below query to show the count of indexes having average fragmentation greater than 30 percent. This query will return a count of indexes.
SELECT count(*) as CountOfAvg_fragmentation_in_percent
FROM sys.dm_db_index_physical_stats(DB_ID(N'AdventureWorks2017'), NULL, NULL, NULL, 'SAMPLED')
where avg_fragmentation_in_percent > 30
Create Custom Insight Widget in SQL Operations Studio
Step 1 – Launch SQL Operations Studio and connect to the database.
Step 2 – Right click on the connection and launch New Query

Step 3 – Copy or write the query then execute it to verify the output of the query we want to display.

Step 4 – In the results pane, towards the right, click View as Chart to create the insight.

Step 5 – Once we click on View as Chart, it opens a new tab Chart Viewer. We can customize the chart as needed.
We have multiple options to display data such as:
- Bar
- Count
- Table
- Pie
- Doughnut
- Horizontal bar
- Line
- Scatter
- Time series

For example, I want to display the result as a table in the insight widget, so I will select Table as the chart type.

Step 6 – In the Chart Viewer, we get these options:
- Save as image
- Copy image
- Create insight

Click Create Insight to generate the JSON and it should show the below JSON code to create the insight.

This is the JSON code we need to update.
{
    "name": "My-Widget",
    "gridItemConfig": {
        "sizex": 2,
        "sizey": 1
    },
    "widget": {
        "insights-widget": {
            "type": {
                "table": {
                    "dataDirection": "vertical",
                    "dataType": "number",
                    "legendPosition": "none",
                    "labelFirstColumn": false
                }
            },
            "queryFile": "SQLQuery7"
        }
    }
}
The details of the JSON fields are as shown below:
| Property | Description |
|---|---|
| Name | The title of the widget |
| gridItemConfig | sizex and sizey specify the dimensions of the widget on the dashboard. We need to change these dimensions in order to adjust the other widgets also. |
| widget | The actual widget configuration |
| type | Chart type
|
| datadirection | Horizontal or vertical |
| dataType | Data type of the output |
Now, save the query to a folder with an appropriate name, for example, I saved the query as C:\mssqltips\SQLOPS\IndexFragmentation.sql

Step 7 – Now we need to open User Settings and paste the code into the database dashboard widget. To open User Settings, go to View > Command Palette > Preferences: Open User Settings as shown below.


This opens up the settings.json file, so we can customize the dashboard widget.

In the User Settings search box, type database to locate a database widget. Below is how it looks.

Step 8 – Now, in the dashboard.database.widgets, edit the JSON with the corresponding entries for the widget.
Before doing so, make the required changes as shown below in the insight code generated in step 6.
{
            "name": "Top Index Fragmentation count", -- Modify the name of the widget
            "gridItemConfig": {
                "sizex": 2,
                "sizey": 1
            },
            "widget": {
                "insights-widget": {
                    "type": {
                        "table": {
                            "dataDirection": "vertical",
                            "dataType": "number",
                            "legendPosition": "none",
                            "labelFirstColumn": false
                        }
                    },
                    "queryFile": "C:\\mssqltips\\SQLOPS\\IndexFragmentation.sql"   --Specify the actual location
                }
            }
        }

Step 9 – Now save the user setting using Ctrl+S.
Step 10 – Launch the database dashboard by right-clicking on the database and selecting Manage.

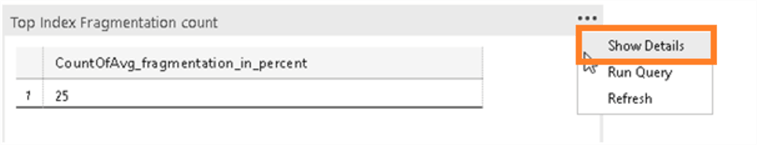
Step 11 – We can see the configured widget 'Top Index Fragmentation Count'

In the above example, we have can see the count of indexes where the avg_fragmentation_in_percent > 30, but we do not see the details. Now we will show how to include the details.
Create Custom Insight Widget with Details in SQL Operations Studio
Step 1 – Open a new query editor and write the code and execute it as follows.
SELECT OBJECT_NAME(OBJECT_ID) as ObjectName, index_id,index_type_desc,index_level,
avg_fragmentation_in_percent,avg_page_space_used_in_percent,page_count
FROM sys.dm_db_index_physical_stats(DB_ID(N'AdventureWorks2017'), NULL, NULL, NULL, 'SAMPLED')
where avg_fragmentation_in_percent > 30
ORDER BY avg_fragmentation_in_percent DESC

Step 2 – Save the query, for example, I save it as C:\mssqltips\SQLOPS\IndexFragmentationDetails.sql

Step 3 – Now follow steps 8 and 9 from above and go to dashboard.database.widgets.
Step 4 – In dashboard.database.widgets, go to our previously configured insight.
"name": "Top Index Fragmentation count",

Step 5 – Now add the below-highlighted fields to add the details insight.
- Query File: Provide the query file location
- Label: Label in the details widget, provide the column name from the query
- Value: Value of the corresponding field in the query output.
"widget": {
                "insights-widget": {
                    "type": {
                        "table": {
                            "dataDirection": "vertical",
                            "dataType": "number",
                            "legendPosition": "none",
                            "labelFirstColumn": false
                        }
                    },--Specify the actual location
                    "queryFile": "C:\\mssqltips\\SQLOPS\\IndexFragmentation.sql",
                    "details": {
                        "queryFile": "C:\\mssqltips\\SQLOPS\\IndexFragmentationDetails.sql",
                        "label": "ObjectName",
                        "value": "avg_fragmentation_in_percent"
                }
            }
        },
Step 6 – Now launch the database dashboard. We can see the option Show Details to see the detail page.
Step 7 – Click on show details and it opens a new window with the details.

This window has two boxes such as:
- Items: Output in the format of columns we specified in the configuration. For example, in my case it shows the object name and its corresponding avg_fragmentation_in_details value.
- ItemValue: Details (query output) of the item selected in the Items Box.
Next Steps
- We explored in this tip how to configure a custom insight widget in SQL Operations Studio. This is a useful way to represent data with easy to configure options. We can add the desired details as well in the details insight page. This can be very useful especially for monitoring purposes where we have the readily available data as an insight widget and a details insight page. Create and explore these features as per your needs.
- Learn more about SQL Operations Studio:
- Stay tuned for further tips on SQL Operations Studio.

Hi! I am Rajendra Gupta, Database Specialist and Architect, helping organizations implement Microsoft SQL Server, Azure, Couchbase, AWS solutions fast and efficiently, fix related issues, and Performance Tuning with over 14 years of experience.
I am the author of the book “DP-300 Administering Relational Database on Microsoft Azure.” I can be reached at: Rajendra.gupta16@gmail.com for any consulting help.
- MSSQLTips Awards:
- Author of the Year – 2022 | Author Contender – 2021/2023/2024 | Champion Award (100+ tips) – 2020