Problem
In my previous tips SQL Operations Studio installation and overview and SQL Operations Studio query editor and source control, we explored SQL Operation Studio features. SQL Operation Studio also provides a facility to configure dashboards for monitoring. In this tip, we will explore creating dashboards with SQL Operations Studio.
Solution
SQL Operations Studio provides a great way to visualize the data with a graphical representation. Visualizations make it easy to understand the data with the help of graphs, charts, etc.
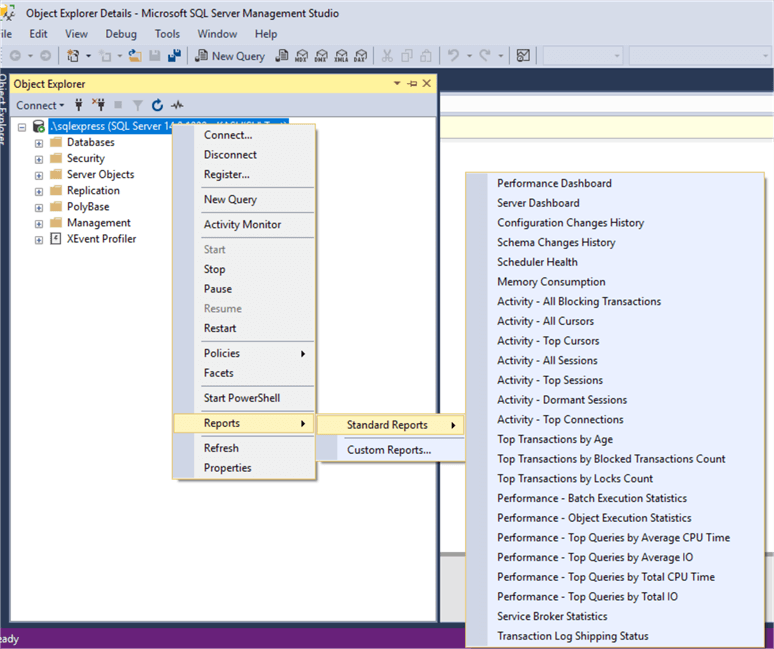
When using SQL Server Management Studio, we have several reports available to look at things at the server and database level as shown below. We will take a look at what we can do with SQL Operations Studio.
Configure Widgets in SQL Operations Studio
SQL Operation Studio provides widgets to represent data with visual images and represents data with interactive chart formats. Widgets can be useful to see server and database level data.
SQL Operation Studio provides built-in sample widgets, however, these are not configured by default. You need to configure them to see them on the dashboard.
Built in dashboards are:
- Database widgets: Table-space-db-insight and Query-data-store-db-insight
- Server widgets: Backup-history-server-insight and all-database-size-server-insight

Note: I am using the SQL Operations Studio February release for this tip.
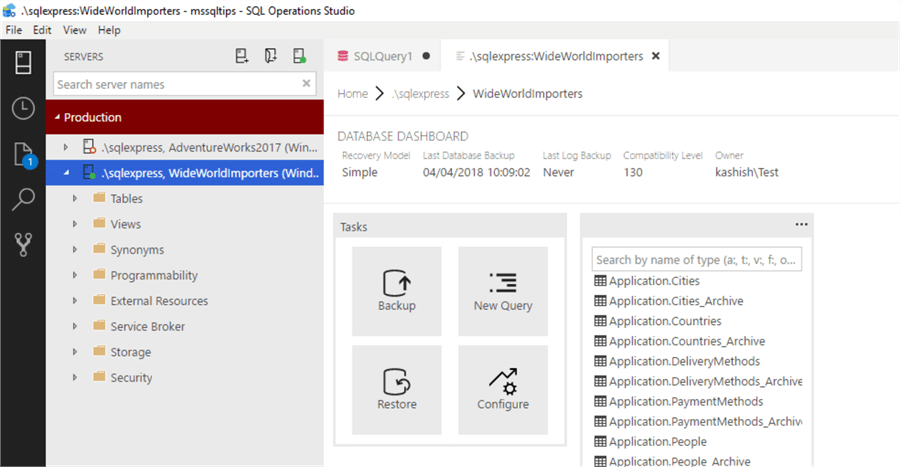
Once we right click on the instance name and click manage, by default the below database dashboard opens.
Add a Database or Server Widget to the Dashboard
We will add a widget to the "dashboard.database.widgets" section into the user settings. Below are the steps to add a widget:
- Launch SQL Operation Studio and connect to the database instance
- To open user settings, press Ctrl+Shift+P or go to View > Command Palette.
- In the command palette that appears, type Open User settings.
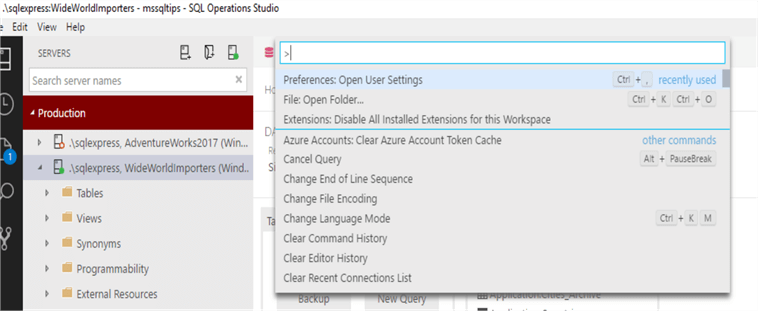
This opens up the 'setting.json' file with the default settings on the left and user settings on the right.
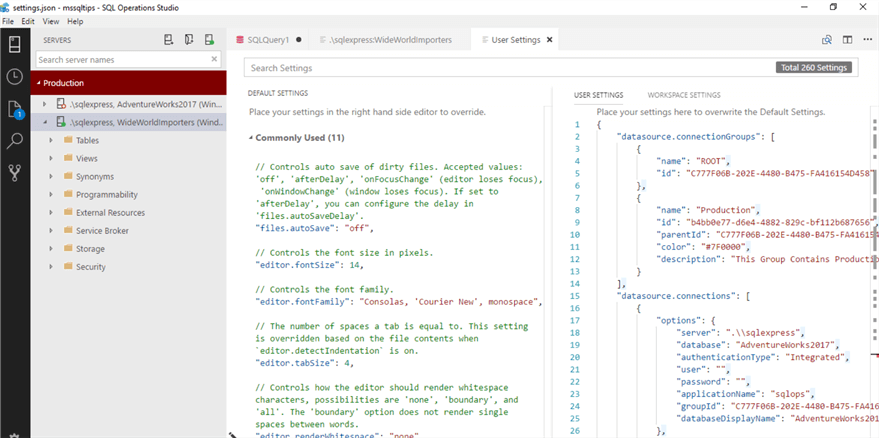
In the User Settings search box, type database to locate a database widget. Below is how it looks.
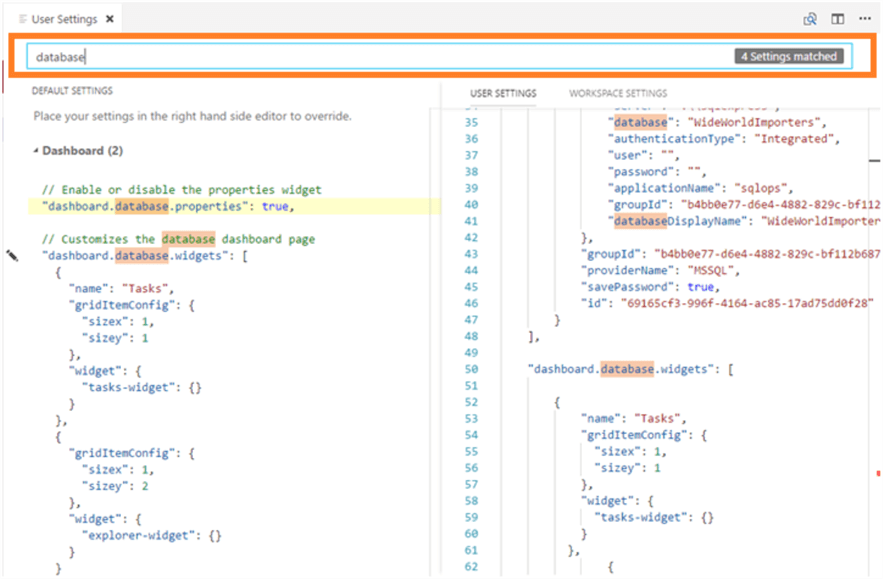
Now, in the dashboard.database.widgets, edit the JSON with the corresponding entries for the widget.
Table Space Usage Widget in SQL Operations Studio
First, we will add table-space-db-insight. To do so, we need to enter the configuration details in JSON format as below.
{
   "name": "Table Space",
    "gridItemConfig": {
       "sizex": 1,
       "sizey": 1
    },
    "widget": {
        "table-space-db-insight": null
    }
},
Below is the description of the fields, which we need to define.
| Property | Description |
|---|---|
name | The title of the widget |
gridItemConfig | sizex and sizey specify the dimensions of the widget on the dashboard. We need to change these dimensions in order to adjust the other widgets also. |
widget | The actual widget configuration |
So the complete JSON for 'dashboard.database.widget' looks like this:
"dashboard.database.widgets": [
   {
      "name": "Tasks",
      "gridItemConfig": {
         "sizex": 1,
         "sizey": 1
      },
      "widget": {
          "tasks-widget": {}
      }
   },
   {
      "name": "Table Space",
      "gridItemConfig": {
         "sizex": 2,
         "sizey": 1
       },
       "widget": {
          "table-space-db-insight": null
       }
   },
Press Ctrl+S to save the user settings.
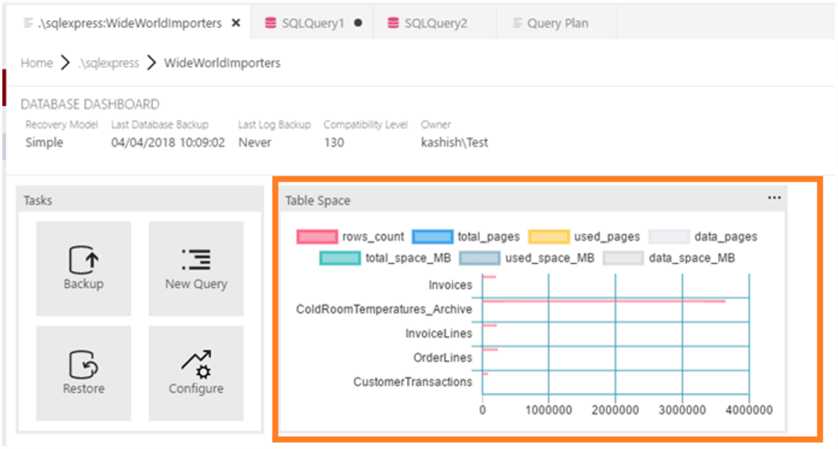
To open the database dashboard, right-click the database and click Manage and we can see the new widget that shows the table space usage in a graphical format.
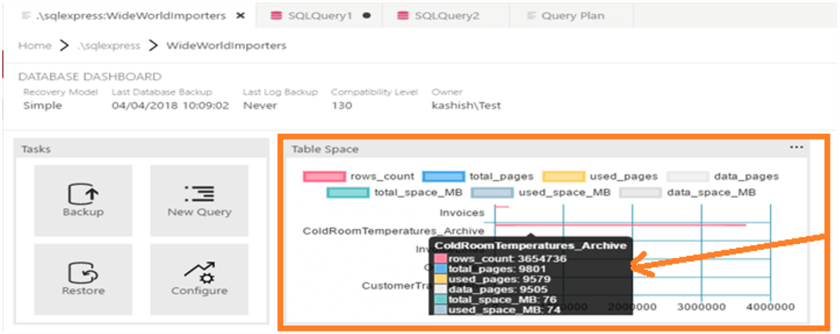
These charts are interactive. If we hover the mouse over the chart, we can see the details including row counts, total pages, data pages, total space, etc. This information is also mapped into the chart as per the color codes as shown below.
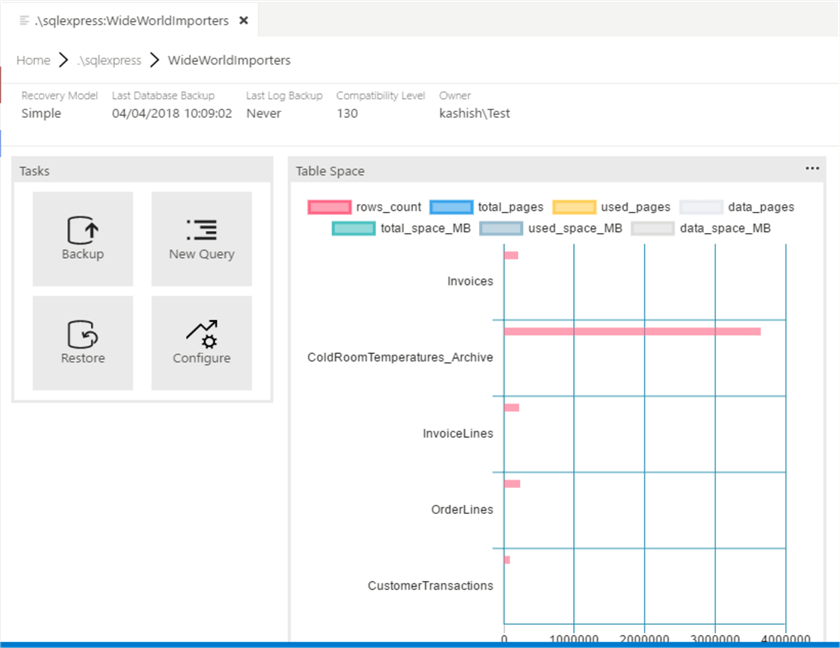
As mentioned earlier, we can change the width and height of widget using the sizex and sizey parameter. So if, we define, sizex and sizey as per the below configuration it changes the widget size.
"gridItemConfig": {
    "sizex": 2,
    "sizey": 2
},
We can see below the widget size is changed per the defined configuration of sizex and sizey above.
If we want to know the query running behind the widget, click on three dots (…) above the widget and then Run Query.
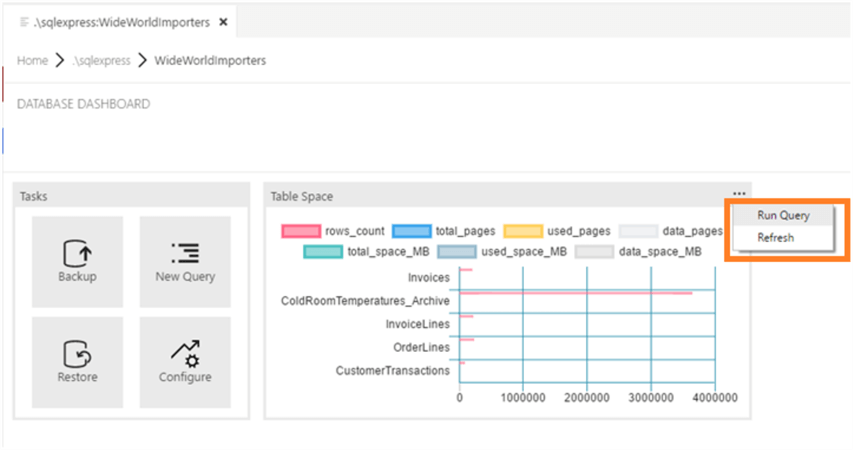
This opens up a new query editor along with the query and the results, so we can see the data and query behind the widget.

Below is the query used in the table-space-db-insight widget.
SELECT Top 5 TABL.name AS table_name,
SUM(PART.rows) AS rows_count,
SUM(ALOC.total_pages) AS total_pages,
SUM(ALOC.used_pages) AS used_pages,
SUM(ALOC.data_pages) AS data_pages,
(SUM(ALOC.total_pages)*8/1024) AS total_space_MB,
(SUM(ALOC.used_pages)*8/1024) AS used_space_MB,
(SUM(ALOC.data_pages)*8/1024) AS data_space_MB
FROM sys.tables AS TABL
INNER JOIN sys.indexes AS INDX
ON TABL.object_id = INDX.object_id
INNER JOIN sys.partitions AS PART
ON INDX.object_id = PART.object_id
AND INDX.index_id = PART.index_id
INNER JOIN sys.allocation_units AS ALOC
ON PART.partition_id = ALOC.container_id
WHERE
INDX.object_id > 255
AND INDX.index_id <= 1
GROUP BY TABL.name,
INDX.object_id,
INDX.index_id,
INDX.name
ORDER BY
(SUM(ALOC.total_pages)*8/1024) DESC
Now let us add more server widgets to show the database size using the same method as above.
Database Size Widget in SQL Operations Studio
This widget, all-database-size-server-insight shows all the database sizes along with data file and log file space. To add this widget, add the below JSON code into the dashboard.database.widgets by following the same steps shown above.
JSON for this looks like:
{
    "name": "Database Size",
    "gridItemConfig": {
        "sizex": 1,
        "sizey": 1
    },
    "widget": {
        "all-database-size-server-insight": null
    }
},
Now the dashboard.database.widget looks as shown below:
"dashboard.database.widgets": [
   {
      "name": "Tasks",
      "gridItemConfig": {
          "sizex": 1,
          "sizey": 1
      },
      "widget": {
          "tasks-widget": {}
      }
   },
   {
      "name": "Table Space",
      "gridItemConfig": {
          "sizex": 2,
          "sizey": 1
       },
       "widget": {
           "table-space-db-insight": null
       }
   },
   {
       "name": "Database Size",
       "gridItemConfig": {
           "sizex": 1,
           "sizey": 1
       },
       "widget": {
           "all-database-size-server-insight": null
       }
   },
]
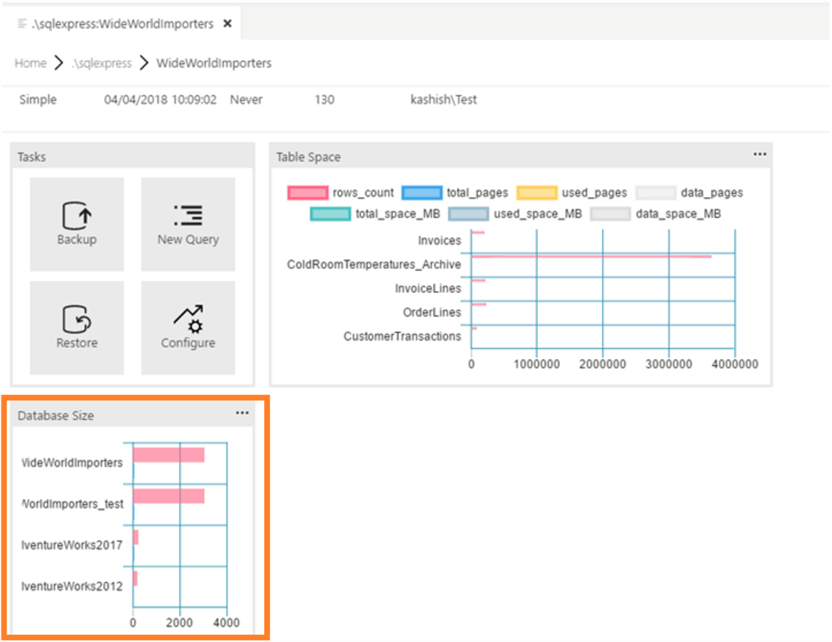
We can see the database size widget below.
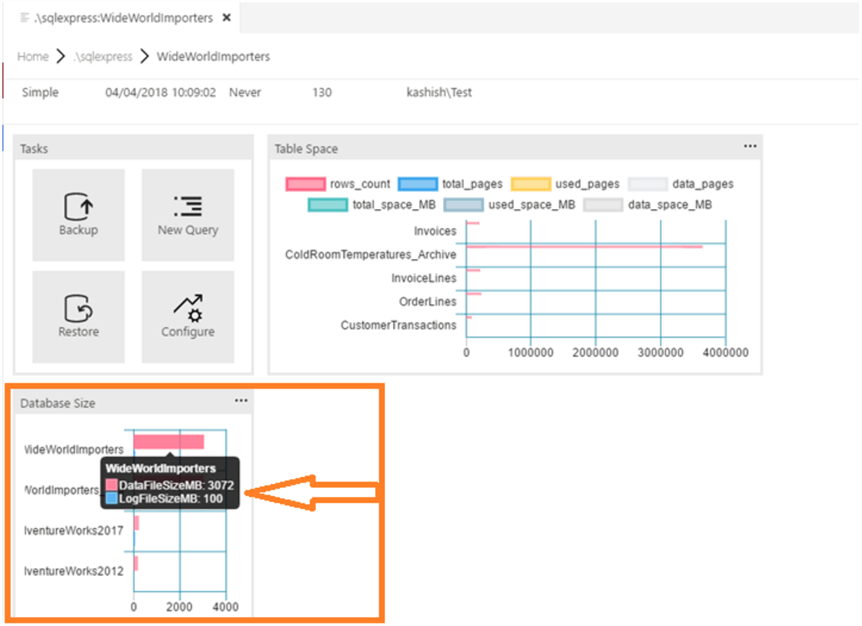
If we hover the mouse over the widget, we can see the data file and log file sizes for that particular database.
As shown earlier, we can generate the script used in the widget by clicking on the three dots (…) over the widget and Run Query.
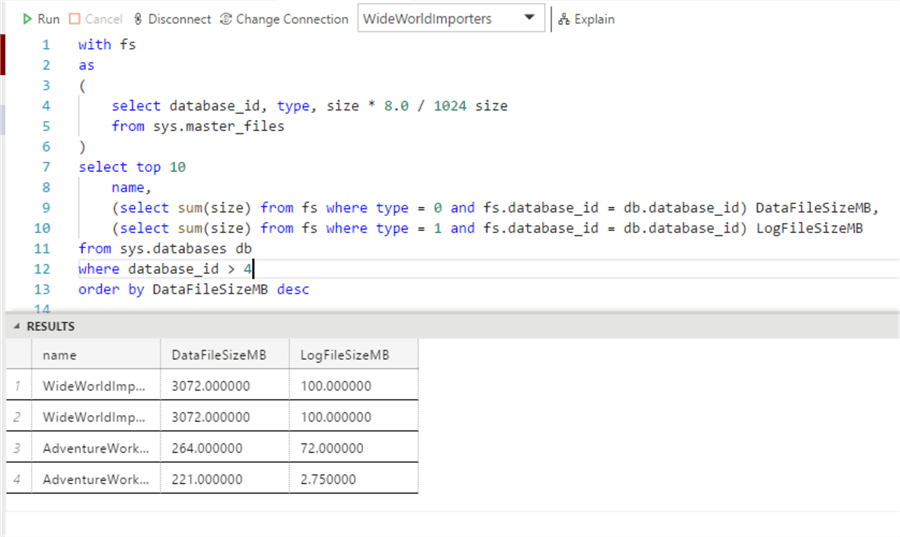
Below is the code for database size widget.
with fs
as
(
    select database_id, type, size * 8.0 / 1024 size
    from sys.master_files
)
select top 10
    name,
    (select sum(size) from fs where type = 0 and fs.database_id = db.database_id) DataFileSizeMB,
    (select sum(size) from fs where type = 1 and fs.database_id = db.database_id) LogFileSizeMB
from sys.databases db
where database_id > 4
order by DataFileSizeMB desc
Query Store Widget in SQL Operations Studio
We can view details of the query plan and performance using the query-data-store-db-insight widget in SQL Operations Studio. To do so, we must enable the query store on the database.
ALTER DATABASE WideworldImporters SET QUERY_STORE = ON --To enable QUERY_STORE on DB
Here is the code for the widget.
--JSON Code to add Query-data-store-db-insight widget
{
"name": "slow queries widget",
"gridItemConfig": {
"sizex": 2,
"sizey": 1 },
"widget": {
"query-data-store-db-insight": null
}
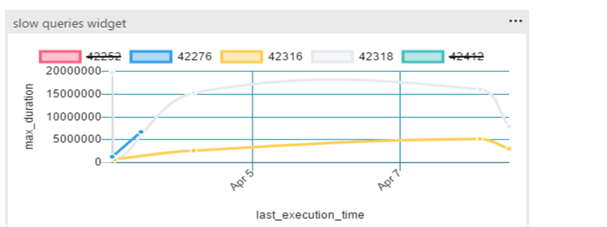
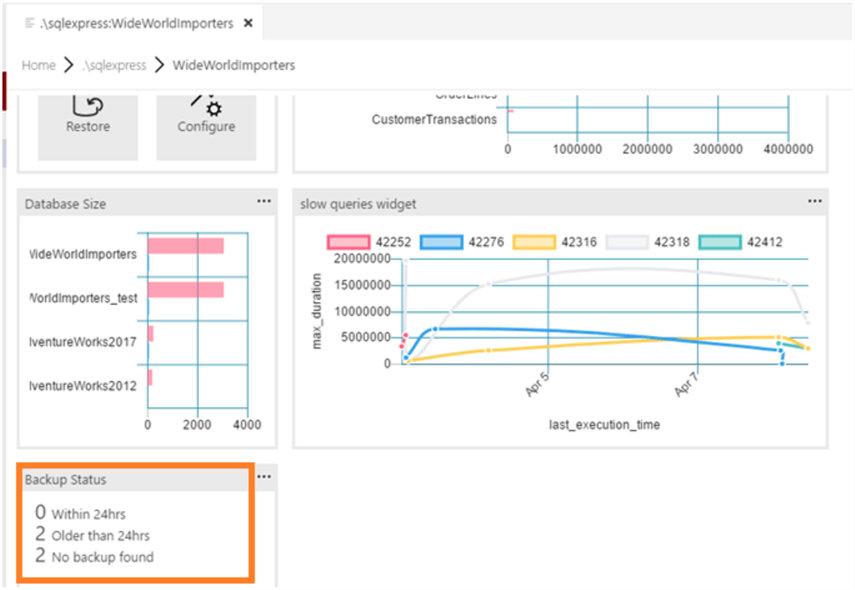
},After adding this widget, if we launch the dashboard, we can see the query store widget.
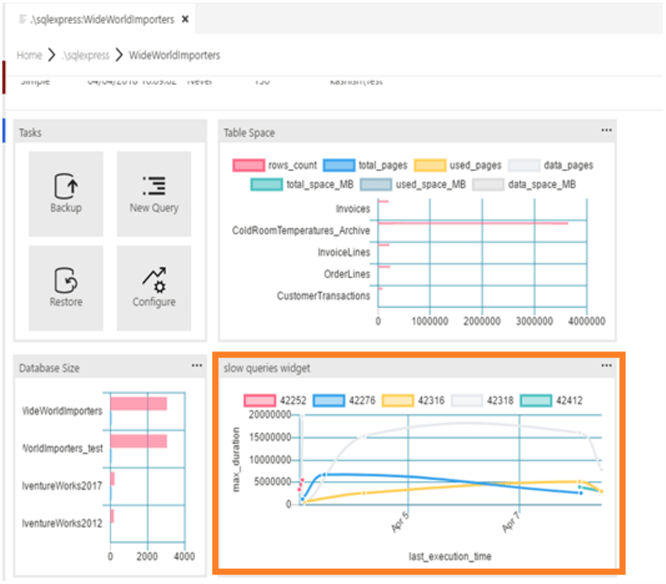
Similar to other widgets, this is also an interactive widget. If we don't want to see a particular query_id just click on it to remove from the chart. That query_id shows up as crossed out.
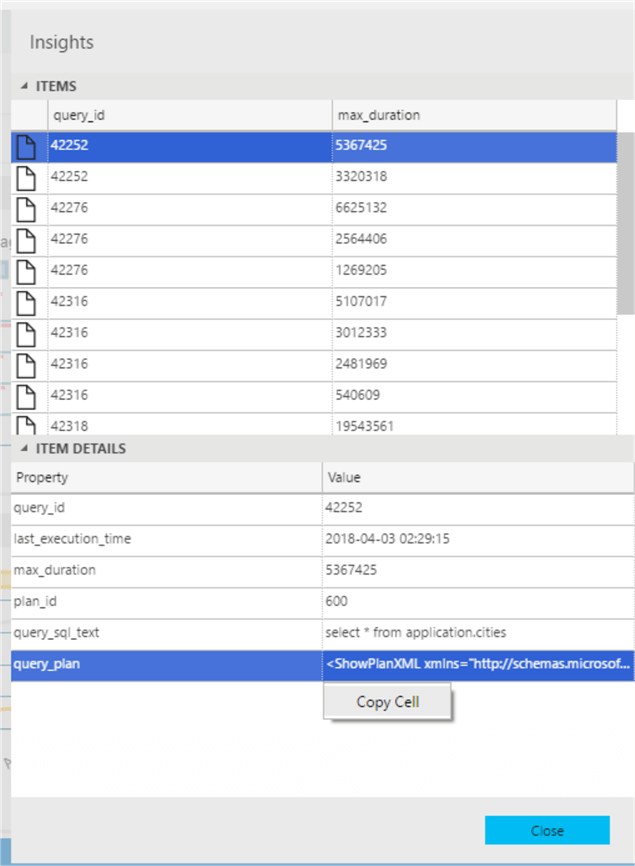
If we click on three dots (…) above the widget, it gives the Show Details option.
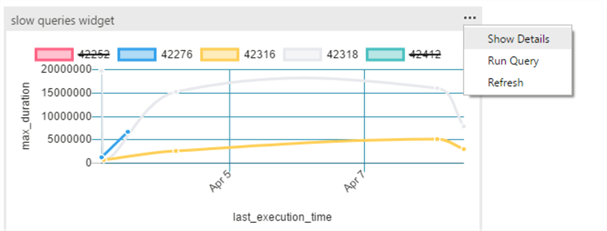
This gives details about query_id and the max duration along with the query_text and the query_plan.
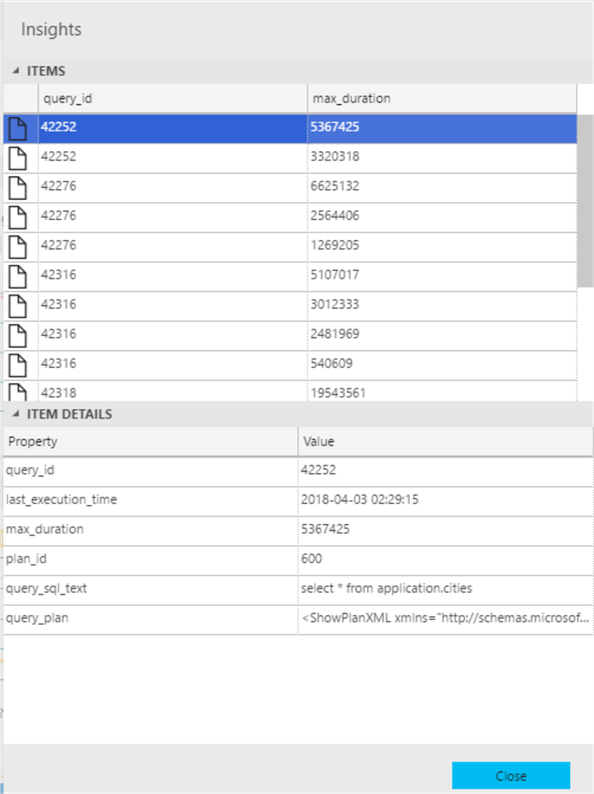
If we want to view the query_plan, right click on query_plan and the Copy Cell.
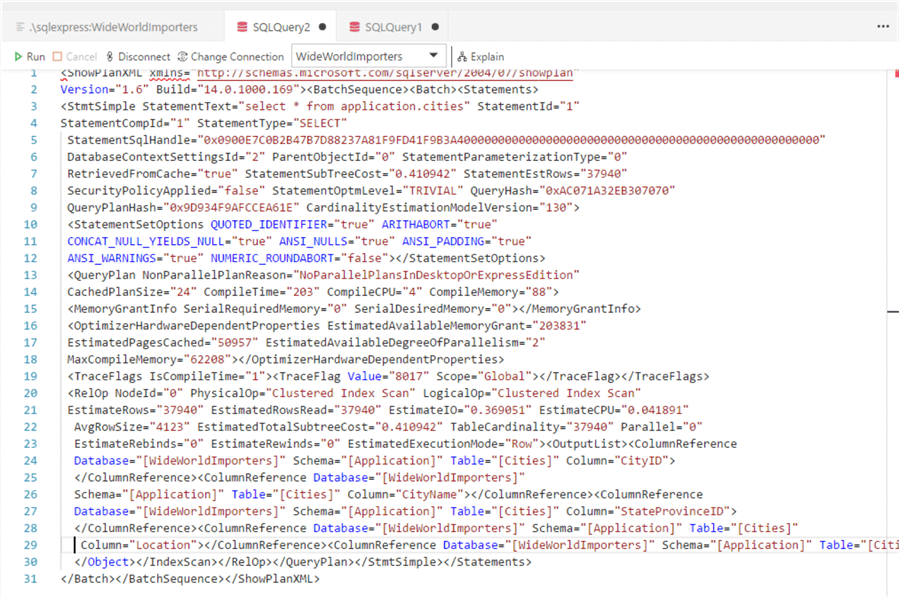
Paste the query_plan into a new SQL editor.
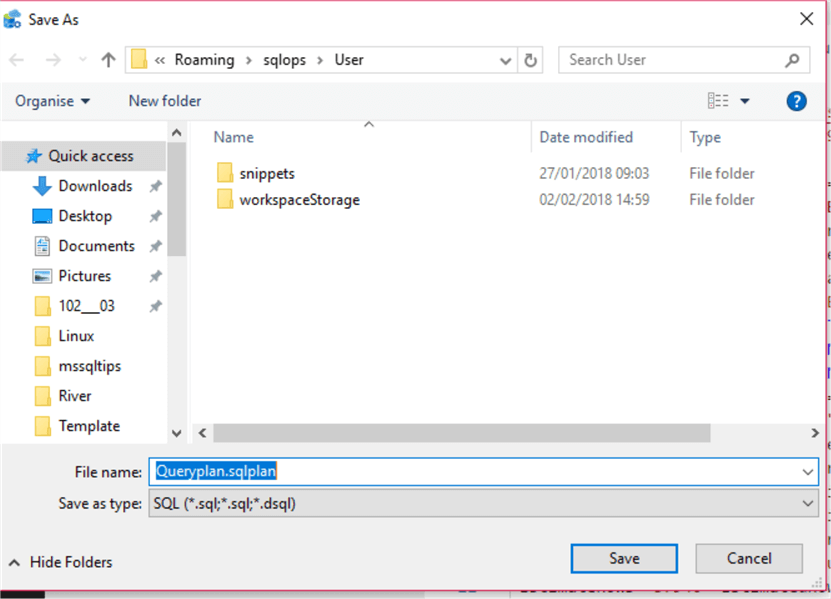
Save this plan with a *.sqlplan extension into the desired location.
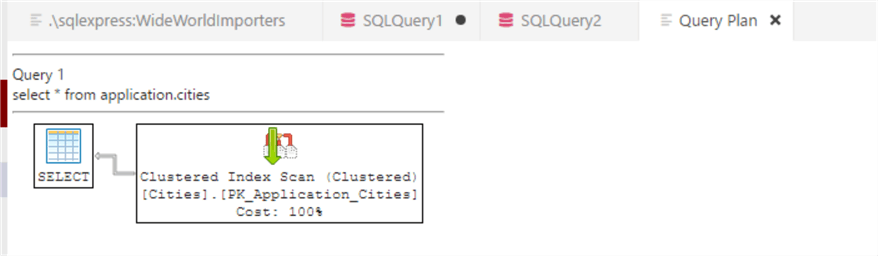
Now open the saved *.sqlplan file and we can see the graphical execution plan.
As shown earlier, if we click on Run Query, we get the query used in the widget.
Below is the code used in this widget.
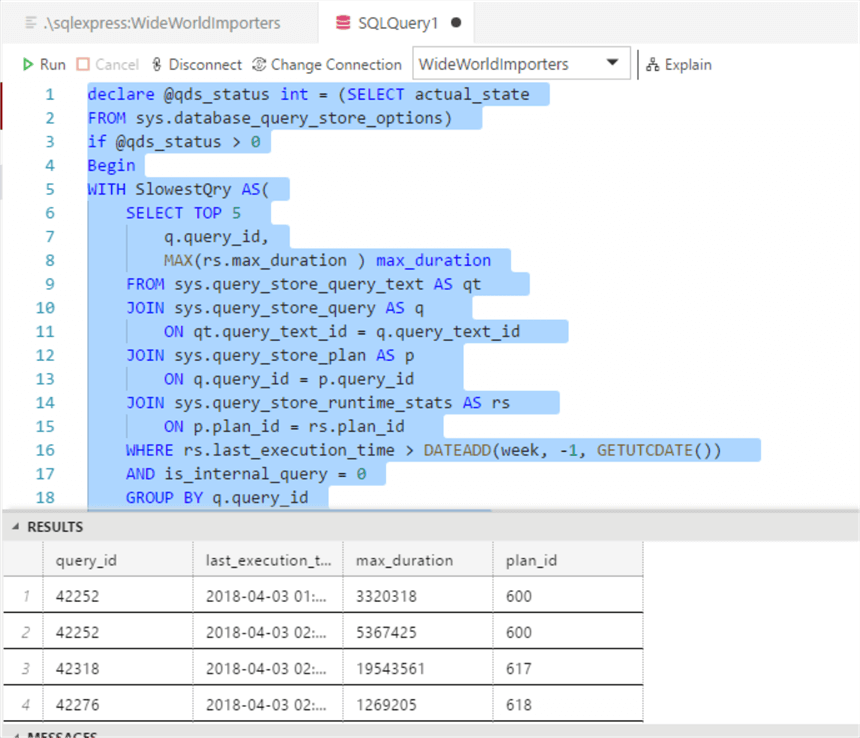
declare @qds_status int = (SELECT actual_state
FROM sys.database_query_store_options)
if @qds_status > 0
Begin
WITH SlowestQry AS(
SELECT TOP 5
  q.query_id,
  MAX(rs.max_duration ) max_duration
FROM sys.query_store_query_text AS qt
JOIN sys.query_store_query AS q
  ON qt.query_text_id = q.query_text_id
JOIN sys.query_store_plan AS p
  ON q.query_id = p.query_id
JOIN sys.query_store_runtime_stats AS rs
  ON p.plan_id = rs.plan_id
WHERE rs.last_execution_time > DATEADD(week, -1, GETUTCDATE())
AND is_internal_query = 0
GROUP BY q.query_id
ORDER BY MAX(rs.max_duration ) DESC)
SELECT
q.query_id,
format(rs.last_execution_time,'yyyy-MM-dd hh:mm:ss') as [last_execution_time],
rs.max_duration,
p.plan_id
FROM sys.query_store_query_text AS qt
JOIN sys.query_store_query AS q
  ON qt.query_text_id = q.query_text_id
JOIN sys.query_store_plan AS p
  ON q.query_id = p.query_id
JOIN sys.query_store_runtime_stats AS rs
  ON p.plan_id = rs.plan_id
JOIN SlowestQry tq
  ON tq.query_id = q.query_id
WHERE rs.last_execution_time > DATEADD(week, -1, GETUTCDATE())
AND is_internal_query = 0
order by format(rs.last_execution_time,'yyyy-MM-dd hh:mm:ss')
END
else
select 0 as [query_id], getdate() as [QDS is not enabled], 0 as  [max_duration]
Datbase Backup History Widget in SQL Operations Studio
The backup-history-server-insight widget gives information about backup status:
- How many backups executed in last 24 hours
- Database without a recent backup in the last 24 hours
- Database count with no backups
Add the below JSON code in the dashboard.database.widget.
 {
   "name": "Backup Status",
   "gridItemConfig": {
       "sizex": 1,
       "sizey": 1
    },
    "widget": {
        "backup-history-server-insight": null
    }
},
We can see the backup status widget as shown below.
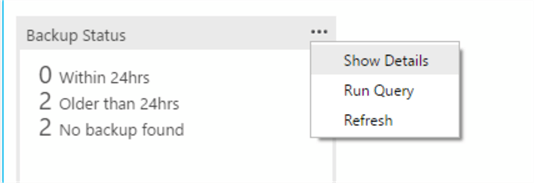
Click on Show Details to get details about each database backup.
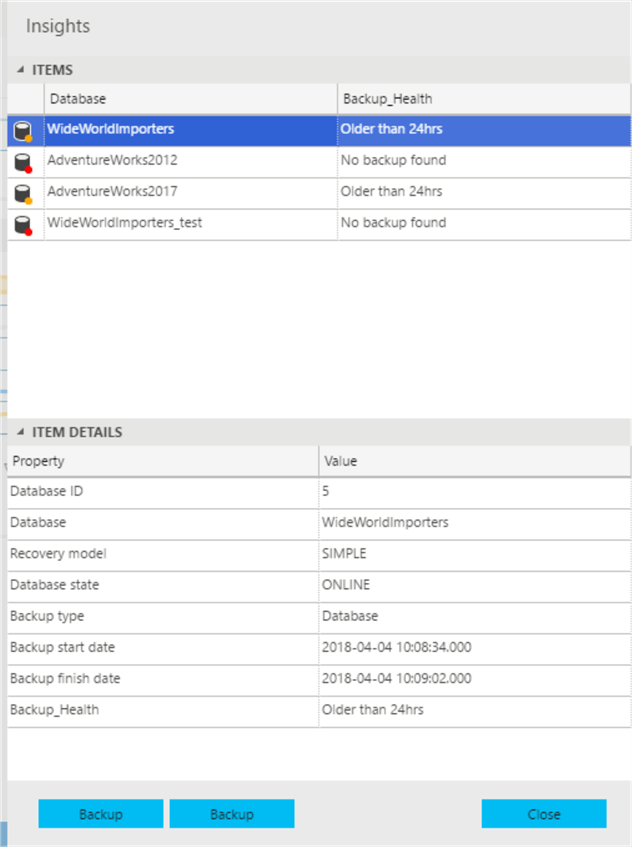
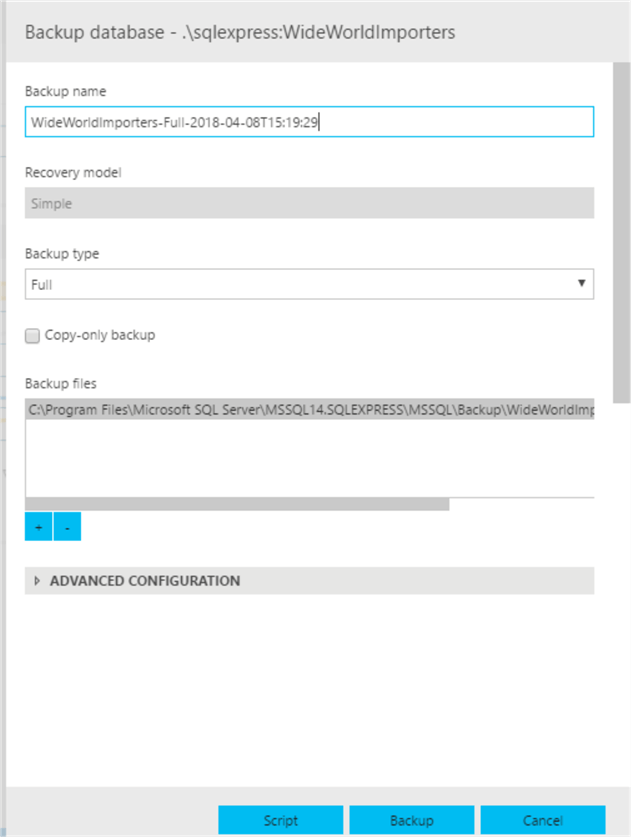
We can also execute a backup from the backup tab at the bottom. Clicking on the backup tab opens up the backup database widget. Simply fill the details and execute the backup.
Below is the query used in the backup widget.
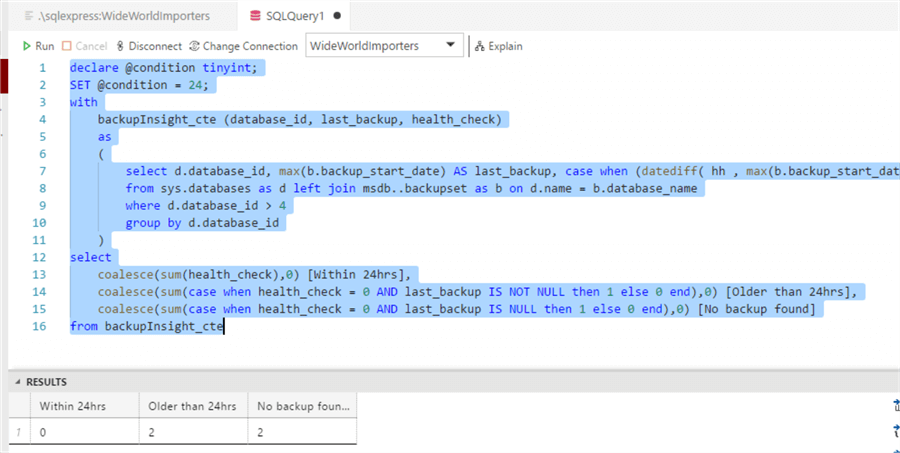
declare @condition tinyint;
SET @condition = 24;
with
    backupInsight_cte (database_id, last_backup, health_check)
    as
    (
        select d.database_id, max(b.backup_start_date) AS last_backup, case when (datediff( hh , max(b.backup_start_date) , getdate()) < @condition) then 1 else 0 end as health_check
        from sys.databases as d left join msdb..backupset as b on d.name = b.database_name
        where d.database_id > 4
        group by d.database_id
    )
select
    coalesce(sum(health_check),0) [Within 24hrs],
    coalesce(sum(case when health_check = 0 AND last_backup IS NOT NULL then 1 else 0 end),0) [Older than 24hrs],
    coalesce(sum(case when health_check = 0 AND last_backup IS NULL then 1 else 0 end),0) [No backup found]
from backupInsight_cte
Refresh Widget Data in SQL Operations Studio
To refresh the widget data, click on the refresh icon. It refreshes all widgets data.
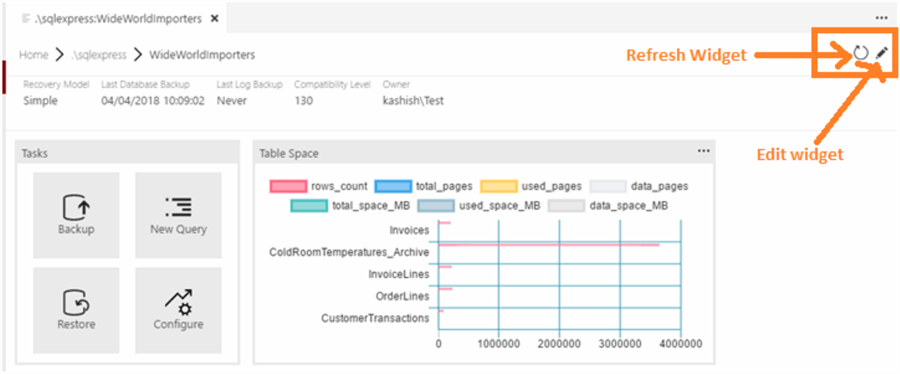
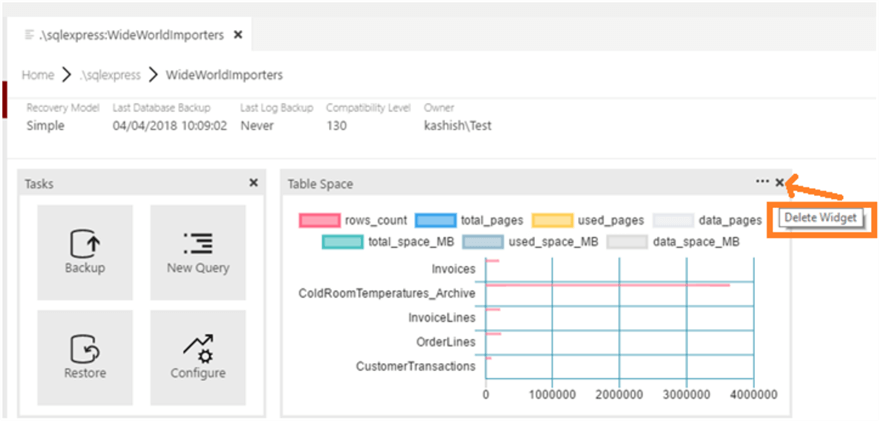
Delete Widget in SQL Operations Studio
To remove a widget, click on edit as shown above and it shows X icon for each widget. Click on the X to remove the widget you want to remove.
Next Steps
- Stay tuned for further tips on SQL Operations Studio.
- Read more about New SQL Operations Studio Installation and Overview.
- Read more about SQL Operations Studio – Query Editor and Source Control.
