By: K. Brian Kelley | Comments (2) | Related: > Functions System
Problem
I know SQL Server has a lot of views and functions which I can use to understand what’s going on with my SQL Server. I’m interested in seeing what SQL Server can tell me about the active requests from connected users and applications. How can I see this information?
Solution
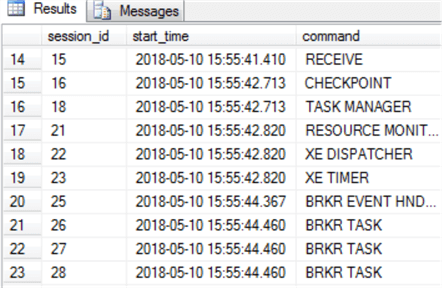
The SQL Server dynamic management view (DMV) you’ll want to use is sys.dm_exec_requests. However, it doesn’t just show us the requests being made from connected users and applications. For instance, we can see that SQL Server has a lot of background tasks, too, using a simple query:
SELECT session_id, start_time, command
FROM sys.dm_exec_requests
WHERE status = 'background';
This is a small sample. The actual query returned over 20 different sessions on my test system.
Typically, though, we’ll use this DMV to troubleshoot active sessions. One of the easiest things to look at is who is experiencing waits:
SELECT session_id, blocking_session_id, start_time, wait_type, wait_type
FROM sys.dm_exec_requests
WHERE blocking_session_id > 0;
And here we see that one session is blocking another. The wait type also tells us what type of lock:

We can determine what the query is/was that has caused the blocking by one of two means:
- If it has an active request, we use sys.dm_exec_requests and sys.dm_exec_sql_text() to pass the sql_handle in.
- If it does not have an active request, we join to sys.dm_exec_connections and pass the most_recent_sql_handle to sys.dm_exec_sql_text().
In this case, I know there’s no active request because I’ve queried sys.dm_exec_requests for session id 53. Therefore, I’ll drop back to the second option:
SELECT DISTINCT DEC.session_id, DST.text AS 'SQL'
FROM sys.dm_exec_requests AS DER
  JOIN sys.dm_exec_connections AS DEC
    ON DER.blocking_session_id = DEC.session_id
  CROSS APPLY sys.dm_exec_sql_text(DEC.most_recent_sql_handle) AS DST;
And we see that the following query is returned:

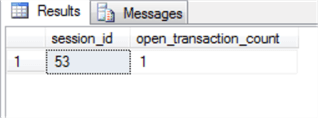
This seems like an innocuous query, a simple insert, so there’s more going on. In this case, it’d be nice to see if there’s a open transaction. If it had an active request, we could look at the open_transaction_count in sys.dm_exec_requests. Since this one does not have an active request, we can check sys.dm_exec_sessions:
SELECT session_id, open_transaction_count
FROM sys.dm_exec_sessions
WHERE open_transaction_count > 0;
And we’ll see that there is an open transaction. So it looks like someone forgot to COMMIT.
Getting the Active SQL Server Plan
If I have a long running query, I may want to see the plan for that query to determine why it’s taking forever. Perhaps the plan is terrible. This query returns the plans for any active queries:
SELECT DER.session_id, DEQP.query_plan
FROM sys.dm_exec_requests AS DER
  CROSS APPLY sys.dm_exec_query_plan(DER.plan_handle) AS DEQP
WHERE NOT DER.status IN ('background', 'sleeping');
And here we see that we have two active queries with plans:

In this case, I know that I ran my query from session 52. Therefore, I want to look at session 53. If I’m using SQL Server Management Studio I can simply click on the XML under query plan to view it graphically.
Get Percent Complete for Active SQL Server Query
One of the nice things that we can find in sys.dm_exec_requests is the percent complete column. For instance, if I want to see how far along a DBCC check is, I could do a simple query where I filter based on the command. In this case I know it’s DBCC TABLE CHECK, so that’s what is in my where clause:
SELECT session_id, start_time, status, database_id,percent_complete
FROM sys.dm_exec_requests
WHERE command = 'DBCC TABLE CHECK';
And we see that we’re about 11% complete:

This obviously can be used to check any long running query.
Get All Active SQL Server Requests to a Particular Database
A lot of times we want to see what all is acting against a particular database. We can use sys.dm_exec_requests for this as well. In this case we’ll want to join to sys.databases in order to filter based on a name. If you know the database ID already, you won’t need to do this join. There is a function DB_ID() which you can use in the WHERE clause to translate a name into the database ID, which you can as well. Also, since I do want to know who is connected and how they’re connected (what application), I’m going to join back to sys.dm_exec_sessions as well. Here’s the query, which filters based on the database named Test.
SELECT DER.session_id, DES.login_name, DES.program_name
FROM sys.dm_exec_requests AS DER
  JOIN sys.databases AS DB
    ON DER.database_id = DB.database_id
  JOIN sys.dm_exec_sessions AS DES
    ON DER.session_id = DES.session_id
WHERE DB.name = 'Test';
And when we run the query, we find there are two active sessions:

Since this is against the sys.dm_exec_requests DMV, we know these are active requests against the Test database. If we are trying to troubleshoot performance problems against a specific database, this is a good place to start. Obviously, we can combine this query with a previous one to get the actual queries being run as well as the execution plans.
Seeing a Count of All Active SQL Server Wait Types
Sometimes we’re trying to diagnose a problem and we want to know if we’re seeing a large number of wait types occurring. We can do this using sys.dm_exec_requests because the current wait type being experienced is presented. Therefore, if we filter out any background or sleeping tasks, we can get a picture of what the waits are for active requests and we can also see if we have a problem. Here’s the query:
SELECT COALESCE(wait_type, 'None') AS wait_type, COUNT(*) AS Total
FROM sys.dm_exec_requests
WHERE NOT status IN ('Background', 'Sleeping')
GROUP BY wait_type
ORDER BY Total DESC;
Here is an example of the query output:
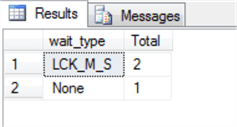
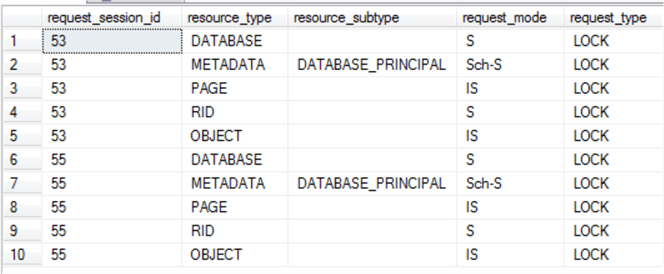
We see that we have two LCK_M_S wait types. This is the wait type we get when we have requests waiting on obtaining a shared lock. We can then query along with sys.dm_tran_locks to determine what types of locks these active requests were trying to obtain:
SELECT L.request_session_id, L.resource_type,
  L.resource_subtype, L.request_mode, L.request_type
FROM sys.dm_tran_locks AS L
  JOIN sys.dm_exec_requests AS DER
    ON L.request_session_id = DER.session_id
WHERE DER.wait_type = 'LCK_M_S';
And here we see the full list for the two session IDs:
There’s more that we can do on the troubleshooting side, but this should give you an idea of the power of sys.dm_exec_requests.
Next Steps
- Read the tip on understanding and using sys.dm_exec_connections.
- See what you can do with sys.dm_exec_sessions.
- Understand how CROSS APPLY and OUTER APPLY work.
- Learn how to estimate approximate remaining time for a query.
About the author
 K. Brian Kelley is a SQL Server author and columnist focusing primarily on SQL Server security.
This author pledges the content of this article is based on professional experience and not AI generated.
View all my tips


