Problem
We are becoming increasingly aware of the power of the hierarchyid data type for org charts and hierarchical data generally. To help us to access this power, we seek some simple examples of how to query employee data with the hierarchyid data type. Also, the business managers in our company regularly use Excel. Therefore, please show us how to transform result sets derived from datasets with the hierarchyid data type to org charts in Excel.
Solution
The hierarchyid data type enriches your capabilities for managing hierarchical data relationships, such as the reporting relationships between employees depicted by an org chart. Business professionals are familiar with org charts as a way of visually depicting who reports to whom in a company. When there are just a few persons in an organization, then you do not need a database to track the employees or an org chart to show who reports to whom. However, as the number of employees grows to tens, hundreds, thousands, and beyond, the reporting relationships become increasingly difficult to track without a database.
A prior tip presents the basics of creating and querying hierarchical data sources with the hierarchyid data type, but the tip did not focus on employee reporting relationships nor org charts, which are widely used for showing employee reporting relationships. This tip leverages the prior tip introducing the hierarchyid data type with examples for specifically querying employee reporting relationships in SQL Server and mapping those relationships as org charts with Excel. In particular, you will see examples on how to
- query and display employee hierarchical data
- list employees by level within an organization and easily add manager name to rows with other employee data
- query for the direct reports to a manager and create an Excel chart depicting the report relationships
- query the direct and indirect reports to a manager and create an Excel chart depicting the report relationships
- change the hierarchical relationships between employees in an organization and create an Excel chart visually showing the changed relationships
Querying and joining a table with hierarchical data to a table of relational data
The hierarchyid data type was introduced by Microsoft into SQL Server as early as the 2008 version, and its popularity is attracting more attention recently among SQL Server professionals. Hierarchyid data type values behave similarly to a column of unique values for employees, but the hierarchyid values also represent the position of an employee in the hierarchy of an organization. The hierarchyid data type encodes the level of an employee in an organization, the depth of an employee relative to other employees in the organization, and even the left-to-right order within an org chart of employees reporting directly to the same manager. The notion of hierarchical depth encompasses the idea of direct and indirect reporting relationships. For example, an indirect report to a top-level manager may report directly to an intermediate level manager, who directly reports to the top-level manager. Indirect reporting relationships can extend through multiple levels within an organization.
The data for employees in the AdventureWorks2014 database is spread across multiple tables with relations between the tables. The following database diagram illustrates some fields that can be extracted from the Person table in the Person schema and the Employee table in the HumanResources schema to populate a new flatter table named EmployeeDemo_whyid. The new table is flatter because it extracts fields from each of the two relational tables into a single table. This kind of flatter table can help to tune the performance of some queries. The first example in this tip illustrates how to derive the EmployeeDemo_whyid table from an inner join of the Person and Employee tables.
The Person and Employee tables can be readily joined because both tables have the same primary key value named BusinessEntityID. While BusinessEntityID values can track individual employees across multiple tables, they do not encode any information about the hierarchical relationships between employees. On the other hand, hierarchyid values do encode information about the hierarchical relationships between employees. The EmployeeDemo_whyid table has the following columns and sources. Each row in the table represents an employee.
- The OrganizationLevel column has smallint data type values that denote the level of an employee within an organization starting with 0 for the CEO at the top-most level. The direct reports to the CEO have a level of 1, their direct reports have a level of 2, and so on down through to the most distant level from the CEO within an organization. The OrganizationLevel for an employee can be derived by the GetLevel method for an employee’s hierarchyid value.
- The emp_OrganizationNode column is a hierarchyid data type that encodes hierarchical information about an employee. Each node, denoted by emp_Organization in the EmployeeDemo_whyid table, points at an employee in the org chart depicting the set of employees in the AdventureWorks company. There are two formats for representing hierarchyid values:
- Hexadecimal values with two characters per byte of storage
- Slash delimiters separating numerical values for parent, child, grandchild nodes and so forth. Slash delimiters for representing hierarchyid values also expose sibling relationships within an organization.
- The NodeString column values display hierarchyid values in slash values. You can derive these slash values as strings by invoking the ToString method for an employee’s hierarchyid value (emp_Organization).
- The Name column values are computed from the FirstName and the LastName column values from the joined result set of the Employee and Person tables. The computed Name column is a familiar way of identifying employees.
- The Title column in the EmployeeDemo_whyid table contains values from the JobTitle column of the Employee table.
- The Gender column is an example of an employee attribute that you may need/want to track for reporting purposes. At a congressional hearing with an all-male panel of bank CEOs, the question was asked: how many CEOs had female executives in line to assume their role after they retired? An org chart that went 2-3 levels down in the organization may have permitted the all-male panel participants to say that there are female executives in positions that are able to achieve that objective in the foreseeable future.
- The ancestor_OrganizationNode column contains hierarchyid values for the ancestor of the current employee in the hierarchy; this is the employee’s manager. If the CEO hierarchyid value is 0x for a hexadecimal value of 0, then all direct reports to the CEO have an ancestor_OrganizationNode value of 0x.

The following script shows the T-SQL code for creating and populating a fresh copy of the EmployeeDemo_whyid table from the Employee and Person tables in the AdventureWorks2014 database. The code has three major segments.
- A use statement specifies the AdventureWorks2014 database as the database context for the script’s code.
- The middle segment
- Instantiates a fresh copy of the EmployeeDemo_whyid table in the HumanResources schema
- Returns a result set based on a join of the Employee and Person tables
- The final segment generates a display with the contents of the EmployeeDemo_whyid table sorted by OrganizationLevel and NodeString.
The middle segment performs the inner join between the Employee and Person tables based on BusinessEntityID. This field is defined as an int data type, and it denotes different types of persons, such as sales contacts and employees. The purpose for performing the join is to bring the FirstName and LastName columns from the Person table into the joined result set with other fields from the Employee table as well as other fields computed explicitly for the EmployeeDemo_whyid table.
Next, a set of columns for the result set are computed via a series of item fields in the list for a select statement.
- The OrganizationLevel column is defined by the outcome of an isnull function
- The function returns the OrganizationLevel value from the Employee table for each employee except for one employee row with an OrganizationLevel value of null
- For the null-value row, the isnull function returns the value 0
- An OrganizationLevel column value of 0 denotes the top level of a hierarchy
- The emp_OrganizationNode column is computed by a case statement
- The initial when clause returns the OrganizationNode from the Employee table so long as it is not null
- When the value is null, then the emp_OrganizationNode column is populated with the GetRoot method; this method returns the hierarchyid value for the root node in an org chart
- The NodeString column also computes its return value via a case statement
- The initial when clause returns the value of the ToString method for the OrganizationNode column value from the Employee table when OrganizationNode is not null
- When the OrganizationNode value is null, as is the case for the CEO in the source data, then the value ‘/’ is assigned to NodeString
- A sole forward slash (‘/’) denotes the NodeString value for the root node in a hierarchy
- The Name column is a simple concatenation of the FirstName and LastName column values from the Person table with a blank space delimiter between the two fields
- The Title column values are the same values as the JobTitle column values from the Employee table
- The Gender column is the concatenation of the field label (‘Sex: ‘) and the Gender column value (M or F) from the Employee table
- The ancestor_OrganizationNode is the output from the GetAncestor method with an argument of 1. This argument returns the hierarchyid value for the parent of the current row
The final segment displays a list in breadth-first order.
- This ordering is specified by designating OrganizationLevel as the first field in the order by clause. A breadth-first order shows all the nodes for a level before moving on to showing the nodes for the next level. In hierarchies for employees, the root node is normally the CEO. The next level consists of direct reports to the CEO. These direct reports frequently are heads of departments or other high-level units within an organization.
- The second field in the order by clause is NodeString; this field represents hierarchyid values internally within SQL Server. Therefore, within each level of this breadth-first listing nodes appear from left to right in the numerical order of their hierarchyid values.
use AdventureWorks2014
go

-- drop EmployeeDemo_whyid if it already exists
if OBJECT_ID('HumanResources.EmployeeDemo_whyid') is not null
drop table HumanResources.EmployeeDemo_whyid

-- Select statement for a list of employees with hierarchyid values
select isnull(OrganizationLevel,0) OrganizationLevel
,
case
   when OrganizationNode is not null then OrganizationNode
   else
hierarchyid::GetRoot()
end emp_OrganizationNode
,
case
   when OrganizationNode is not null  then OrganizationNode.ToString()
   else  '/'
end NodeString
,FirstName + ' ' + LastName [Name]
,[JobTitle] Title
,'Sex: ' + [Employee].[Gender] [Gender]
,OrganizationNode.GetAncestor(1) ancestor_OrganizationNode
into HumanResources.EmployeeDemo_whyid
from HumanResources.Employee
inner join Person.Person
on Employee.BusinessEntityID = Person.BusinessEntityID

-- list of employees in breadth-first order
-- from HumanResources.EmployeeDemo_whyid
select EmployeeDemo_whyid.*
from HumanResources.EmployeeDemo_whyid
order by OrganizationLevel, NodeString
The next screen shot shows the first thirty-four rows of output from the preceding script.
- This is a breadth-first listing of the employees. Therefore, all the employees at one organization level appear before any employees at the next level. The output shows rows for employees with OrganizationLevel values of 0, 1, and 2. The rows with an OrganizationLevel of 1 are highlighted in rows two through seven. All of the rows in this set appear after the row for the employee with an OrganizationLevel value of 0 and before the rows with an OrganizationLevel value of 2.
- Because the second-level order by column is NodeString, rows appear in NodeString order within an OrganizationLevel. Therefore, the highlighted set of rows are listed from /1/ for the first row in the set through /6/ for the last row in the set.
The emp_OrganizationNode column displays the hexadecimal characters for the hierarchyid value associated with an employee. Ken Sánchez has a hex representation of 0x to denote a hexadecimal value of zero; this hex value corresponds to a bit steam composed of eight zeroes. The next listed employee is Terri Duffy. She has a hex representation of 0x58; the bit stream for the two hex digits of 5 and 8 combine into a single byte of 01011000.
Another column with hierarchical values is the last one with name of ancestor_OrganizationNode. This column displays the OrganizationNode value for the parent of the current row. For example, Terri Duffy in row 2 reports directly to Ken Sánchez. Therefore, Ken Sánchez is the parent ancestor of Terri Duffy. Consequently, 0x, which is the hierarchyid value for Ken Sánchez, appears as the ancestor_OrganizationNode value for Terri Duffy. The same assignment rule applies to other rows in the ancestor_OrganizationNode column.

Adding Manager Names to an employee table
When working with hierarchical employee data, it is common to want easy access to manager names for employees. The query in this section presents a script for populating a new table that adds manager names to the contents of the EmployeeDemo_whyid table. The new table with the manager names has the name EmployeeDemo_whyid_wman_names.
As with the script for the previous section, there are three segments to the script.
- The initial segment drops any prior version of the EmployeeDemo_whyid_wman_names table. The database context is implicitly the AdventureWorks2014 database.
- The middle segment does most of the work.
- This segment consists of an outer select statement that joins a column of manager names from a nested query (ancestor_names) to the EmployeeDemo_whyid table. This outer query also instantiates and populates the EmployeeDemo_whyid_wman_names table. This new table has one column of manager names added to the right of its ancestor_OrganizationNode column.
- Within the ancestor_names subquery, a join is performed between two derived tables.
- The first derived table (distinct_ancestor_OrganizationNodes) builds a result set of distinct hierarchyid values for nodes that have at least one other employee node directly reporting to them. This derived table of hierarchyid values is for all managers except the CEO, who does not have a manager.
- The second derived table (OrganizationNode_with_Names) has two columns – one of hierarchyid values for all employees and the second of Name values from the EmployeeDemo_whyid table.
- An inner join within the ancestor_names subquery between the distinct_ancestor_OrganizationNodes derived table and the OrganizationNode_with_Names derived table returns a subset of rows just for managers of hierarchyid values and Name values.
- A left join of the result set from the ancestor_names subquery to the EmployeeDemo_whyid table creates a new result set with the columns from the EmployeeDemo_whyid table plus one additional column for the name of each employee’s manager, except the CEO who has no manager.
- The into clause in the outer select statement instantiates and populates the EmployeeDemo_whyid_wman_names table with the result set from the left join.
- The last segment of the following script is a select statement that displays all columns from the EmployeeDemo_whyid_wman_names table. The order by clause displays the rows in depth-first order. You can sort rows by hierarchyid values to return a depth-first listing of the rows. This kind of order starts a separate branch of employees from each manager reporting in the CEO. Recall that by depth-first, we mean all employees directly or indirectly to a manager. Because there are six managers reporting to the CEO, there are six branches of employees reporting to the CEO.
-- drop EmployeeDemo_whyid_wman_names if it already exists
if OBJECT_ID('HumanResources.EmployeeDemo_whyid_wman_names') is not null
drop table HumanResources.EmployeeDemo_whyid_wman_names
go

-- list of employees with manager names
select EmployeeDemo_whyid.*, ancestor_names.ancestor_Name
into HumanResources.EmployeeDemo_whyid_wman_names
from HumanResources.EmployeeDemo_whyid
left join
(
-- distinct non-null ancestor_OrganizationNode with Name
select distinct_ancestor_OrganizationNodes.ancestor_OrganizationNode, Name ancestor_Name
from
(
-- distinct non-null ancestor_OrganizationNode; this set is for manager nodes
-- from HumanResources.EmployeeDemo_whyid
select distinct ancestor_OrganizationNode
from  HumanResources.EmployeeDemo_whyid
where ancestor_OrganizationNode is not null
) distinct_ancestor_OrganizationNodes
inner join
(
-- distinct non-null ancestor_OrganizationNode; this set is for employee nodes
-- from HumanResources.EmployeeDemo_whyid
select emp_OrganizationNode, Name
from  HumanResources.EmployeeDemo_whyid
) OrganizationNode_with_Names
on distinct_ancestor_OrganizationNodes.ancestor_OrganizationNode
   = OrganizationNode_with_Names.emp_OrganizationNode
) ancestor_names
on EmployeeDemo_whyid.ancestor_OrganizationNode = ancestor_names.ancestor_OrganizationNode

-- display a depth-first list of employees with manager names
select *
from HumanResources.EmployeeDemo_whyid_wman_names
order by emp_OrganizationNode
Here’s an excerpt from the output generated by the preceding script. The excerpt displays the first twenty-four rows of output. This output starts with the root node for the CEO. The next twenty-three rows are for two separate branches off the root node.
- The nodes from row 2 through row 15 comprise the first branch. This branch originates with Terri Duffy who serves as Vice President of Engineering and who reports directly to the CEO. All other nodes in the first branch report directly or indirectly to Terri.
- Terri’s NodeString value is /1/.
- Terri has just one node connecting directly to her. This node is for Roberto Tamburello, the Engineering Manager. Roberto’s NodeString value is /1/1/.
- The remaining Engineering staff members report either directly or indirectly to Roberto.
- For example, Rob Walters is a Senior Tool Designer who reports directly to Roberto. The NodeString for Rob is /1/1/1/.
- Dylan Miller is another direct report to Roberto, but Dylan has three other employees who report directly to him. Dylan’s NodeString is /1/1/4/.
- The direct reports to Dylan have NodeString values of /1/1/4/1/, /1/1/4/2/, and /1/1/4/3/.
- Diane Margheim has a NodeString value of /1/1/4/1. She reports directly to Dylan and indirectly to Roberto.
- The nodes in the second branch extend from row 16 through row 24. This branch originates with David Bradley, the Marketing Manager.
- Just like Terri, David also reports to the CEO. David’s NodeString is /2/.
- David’s branch is flatter than Terri’s branch.
- David has eight employees that report directly to him. Their NodeString values are from /2/1/ through /2/8/.

A query and an org chart for the direct reports to the CEO
This section presents the basics of how to create a list of employees from SQL Server that you pictorially display as an org chart in Excel. You can show just the top managers within an organization by querying with SQL Server for the CEO and those who report directly to the CEO. Next, you can create with Excel an org chart image for these employees that portrays their names, titles, and reporting relationships. This section describes how to accomplish these tasks.
The following query returns just the CEO and those who report directly to the CEO from employee data in the EmployeeDemo_whyid_wman_names table. The where clause restricts the result set to employees on levels 0 and 1 of the employee hierarchy. The employee on level 0 is the CEO. The employees on level 1 are the direct reports to the CEO. The order by clause sorts the rows in the result set by hierarchyid values in the emp_OrganizationNode column.
-- list of employees in depth-first order
-- for employees on levels 0 and 1
select EmployeeDemo_whyid_wman_names.*
from HumanResources.EmployeeDemo_whyid_wman_names
where OrganizationLevel in (0,1)
order by emp_OrganizationNode
Here’s a result set from the preceding query. It contains just seven rows — one for the CEO and six more for the direct reports to the CEO. The Name and Title columns are highlighted. The ancestor_Name column confirms that each of the employees in rows 2 through 7 report to the CEO, Ken Sánchez. The six employees in rows 2 through 7 are all the employees on the second level of the employee hierarchy. The rows are ordered by the emp_OrganizationNode column values. The screen shot displays hexadecimal characters (0…9, A..F) in the emp_OrganizationNode column, but SQL Server stores internally the bit stream equivalence of these characters. The order by clause directs SQL Server to sort rows by the numerical equivalence of the stored bit streams.

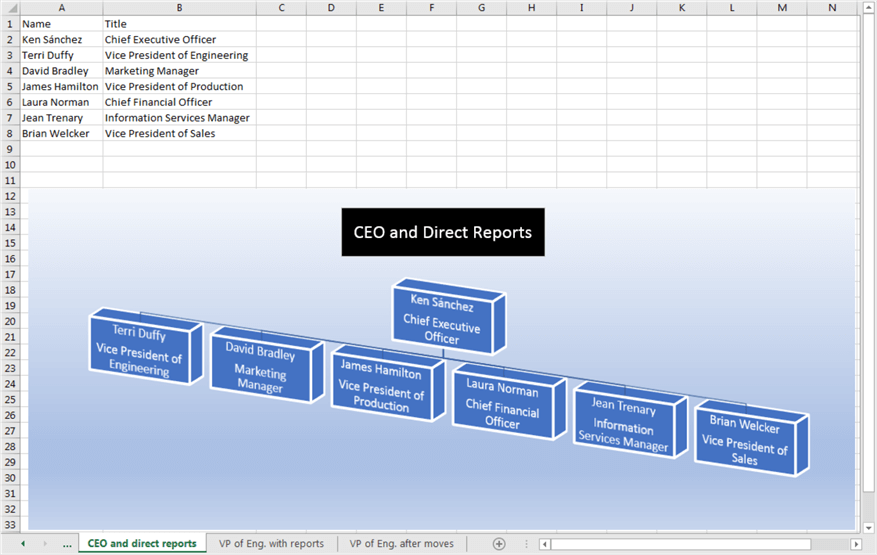
The following screen shot shows a completed org chart in Excel based on the data in the Name and Title columns from the preceding screen shot.
- The data displayed in cells A1..B8 is populated from the Name and Title columns in the preceding screen shot.
- You can easily copy the data from SQL Server to Excel by right-clicking anywhere in the highlighted cells within SQL Server Management Studio and choosing Copy with Headers.
- Next, with cell A1 selected in Excel, choose Edit, Paste to complete copying a segment from a small result set into Excel.
- The Org chart in Excel appears below with the copied employee data from SQL Server.
- Below the copied data is an org chart populated based on values from cells A2..B8 into a hierarchy display template.
- After some minor clean-up work on the copied values to the template, you can modify the arrangement of boxes with employee names and titles.
- Next, you can alter background of the org chart and add a chart title (CEO and Direct Reports) into a text box that overlays the org chart.
Add an org chart template to an Excel tab with these steps.
- Choose the SmartArt icon from the Illustrations menu item within the Insert menu bar.
- Then, select Hierarchy from the left-hand margin border.
- Next, select the specific hierarchical diagram type that comes closest to the one you want and click OK in the dialog box as depicted below.

Next, you can format and populate the template.
- Start by copying the CEO information from the Excel tab in cells A2..B2 into the Windows clipboard.
- Then, paste the clipboard contents into the first [Text] prompt within the "Type your text here" dialog.
- Conclude the populating and formatting of the CEO box by editing the text so that it appears as shown below.
- Formatting the Name and Title text for a box can be accomplished with three steps.
- Backspace within a box from the beginning of the Title text to the end of the Name text.
- Insert one blank space between the end of the Name text and the beginning of the Title text.
- From the end of the Name text enter a carriage return (for example, by hitting the Enter key on a keyboard).

Next, select and delete all boxes except the box in the bottom right-hand corner. Then, copy the contents from cells A3..B8 to the [Text] prompt in the T dialog. This step copies the contents from each of the selected rows into a corresponding box within the org chart; the populated boxes appear below the CEO box. The following screen shot shows the boxes with unformatted contents. Then, just format the contents of the direct report boxes in the same way that you did the contents for the CEO box.

After formatting the contents of the direct report org chart boxes, your org chart is essentially completed in a basic way. However, there are lots of formatting options that can enhance the appearance of the basic org chart for presentation in a group meeting if that’s the goal. For example, right-clicking anywhere inside the org chart, selecting Style, and then clicking the Brick Scene chart icon converts the basic chart so that it may be more suitable for a group meeting. See the screen shot below for a visual demonstration of the last of these steps. This tip leaves the discovery of more formatting refinements up to you to explore and use on your own.

A query and an org chart for a whole branch of reports to the CEO
The prior section was for querying and making an org chart for the top level of manager/employees within a company at both level 0 for the CEO and level 1 for the CEO’s direct reports. Although the order by clause references the Emp_OrganizationNode column, the org chart is a breadth-first chart. This is because employees were included in the chart only if they belonged to either the first or second level within an organization. The chart portrays the breadth of employees comprising the second level from Terri Duffy through Brian Welcker. The use of the Emp_OrganizationNode in the order by clause merely ensures that employees appear based on their hierarchyid value from left to right.
This section presents a query and org chart for a branch from the root node that includes four levels of the employee hierarchy from Terri Duffy, Vice President of Engineering, through three hierarchical levels below her. The query statement to extract Terri’s branch from the employee hierarchy appears below.
- This query, like the one in the preceding section, also uses the EmployeeDemo_whyid_wman_names table as its source.
- The where clause designates that all nodes in the result set must start with a NodeString value of /1/. Because the /1/ points to Terri Duffy all nodes in the branch are for Terri Duffy, her direct reports, and her indirect reports. Other employees in branches not headed by Terri Duffy are implicitly excluded from the result set.
- Terri’s branch is part of the overall employee hierarchy because Terri reports directly to Ken Sánchez, who heads the overall AdventureWorks organization.
- The order by clause references the Emp_OrganizationNode column. This clause orders result set rows by hierarchyid values in the column. Because hierarchyid values increase from the top to the bottom of the employee hierarchy.
-- list of employees in depth-first order
-- for Vice President of Engineering and direct reports
-- from HumanResources.EmployeeDemo_whyid_wman_names
select EmployeeDemo_whyid_wman_names.*
from HumanResources.EmployeeDemo_whyid_wman_names
where NodeString like '/1/%'
order by emp_OrganizationNode
Here’s the result set from the preceding query.
- It is easy to see the rows are in order by NodeString value. Recall that NodeString values can be derived from the application of the ToString method to Emp_OrganizationNode values. The NodeString order reflects a depth relationship.
- The row for Terri Duffy (/1/) precedes the row for Roberto Tamburello (/1/1/). This is a depth relationship because Terri is above Roberto in the employee hierarchy. The ancestor_Name column also confirms this depth relationship because it shows that Terri is the ancestor of Roberto.
- Similarly, the row Dylan Miller (/1/1/4) is above the row for Diane Margheim (/1/1/4/1). Again, a check of the ancestor_Name confirms that Dylan is the ancestor of Diane.
- The NodeString value can also indicate the left-to-right position of nodes at the same level in a hierarchy; these relationships are commonly referred to as sibling and cousin relationships within a family hierarchy.
- So, Rob Walters and Gail Erickson both appear on level 3 of the employee hierarchy, and both employees have the same ancestor.
- Nevertheless, Rob appears before Gail because his NodeString value (/1/1/1/) is lower than her NodeString value (1/1/2/).
- The same kind of left-to-right order of employees in the hierarchy occurs between Diane Margheim and Gigi Matthew. Diane’s row appears before Gigi’s row because Diane’s NodeString value (/1/1/4/1/) is lower than Gigi’s NodeString value (/1/1/4/2/).

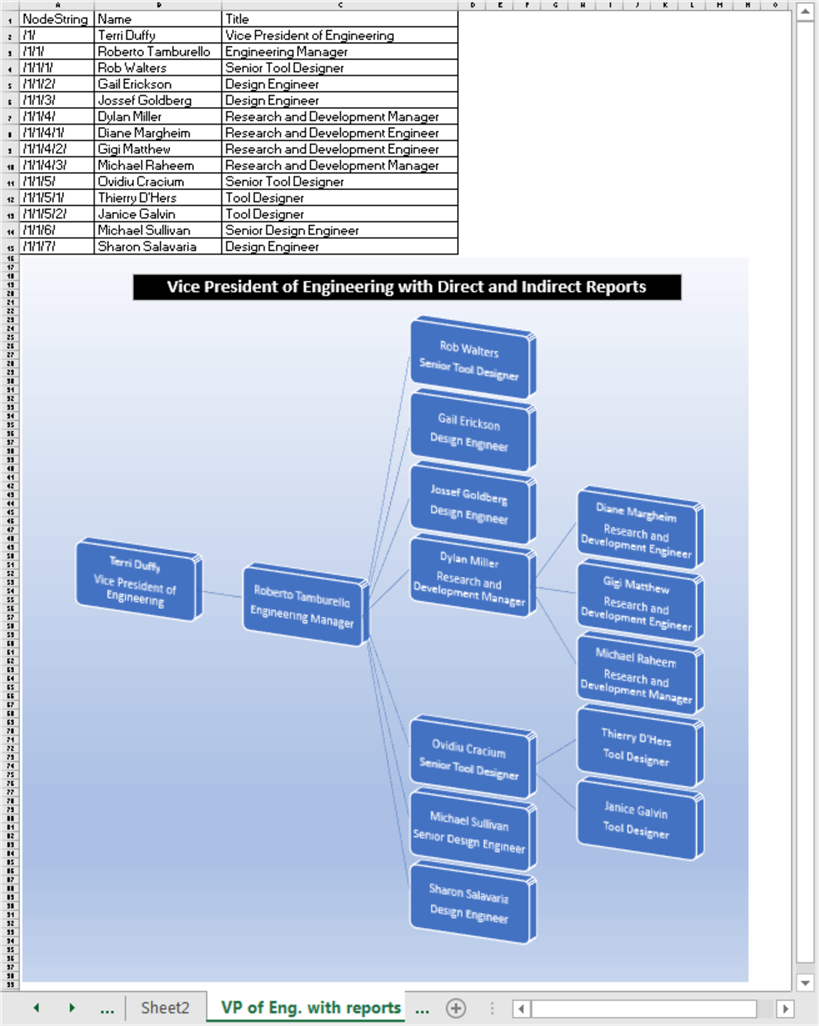
The next screen shot displays the data from NodeString, Name, and Title columns in the preceding result set along with an org chart created within Excel for the copied data.
- The copied data appears in cells A1..C15.
- The top-most node (for Terri) appears in the left-most position on the chart, and the right-most nodes appear at bottom of the employee hierarchy. The right-most nodes at the bottom of the employee hierarchy include those for Diane, Gigi, Michael, Thierry, and Janice.
- From the chart, you can easily tell that the node for Roberto is below the node for Terri.
- Similarly, the nodes for Diane and Gigi are both below the node for Dylan.
- You can also easily see Diane and Gigi are at the same level in the employee hierarchy, but that the node for Diane appears before the node for Gigi. The hierarchy is oriented so the top-most node appears on the left, and nodes at the same level in the hierarchy appear vertically instead of horizontally.
What follows is a selection of step-by-step screen shots for creating an org chart like the one in the preceding screen shot.
Here’s a screen shot showing the selection of the horizontally oriented org chart. Recall that you get to this dialog by choosing the Illustrations menu item from the Excel Insert menubar, and then the SmartArt icon to open a dialog from which you can select Hierarchy in the left-had margin. The screen shot below shows the horizontal org chart template selected. Clicking OK opens a template for the horizontal org chart on your workbook tab. The red rectangle around the two nodes in the bottom branch is for discussion purposes.

Here’s another screen shot of the org chart in the process of preparation.
- The horizontal org chart template was added to the tab.
- The lower branch of the org chart consisting of two nodes was deleted. These nodes are within a red rectangle in the preceding screen shot.
- Text for the two successive top-most nodes are added to and formatted in the left-most and next-to-left-most boxes of the org chart.
- One of the remaining two third-tier boxes is deleted so that just a single third-tier box is left.
- The Name and Title text is copied for the seven third-tier nodes (/1/1/1/ through /1/1/7/) to a Notepad session.
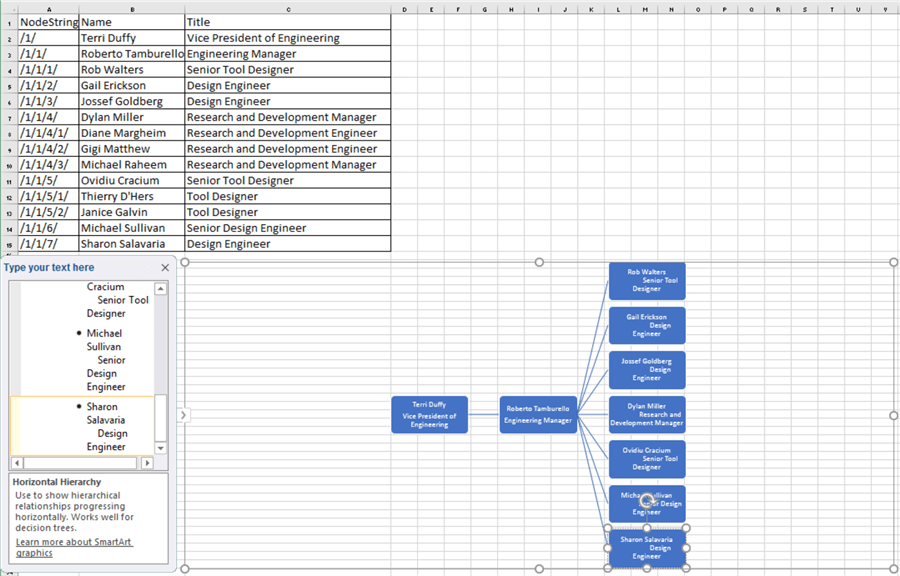
- The seven lines of text from the NotePad session are copied to the "Type your text here" dialog for the sole third-tier box to the left of the org chart. As a result of the copy, seven third-tier boxes are automatically generated in the org chart.
- Unformatted copied Name and Title text appears in the seven boxes on the right edge of the org chart below.
- Before further alterations to the org chart, you may find it helpful to format the Name and Title text as described in the preceding section.
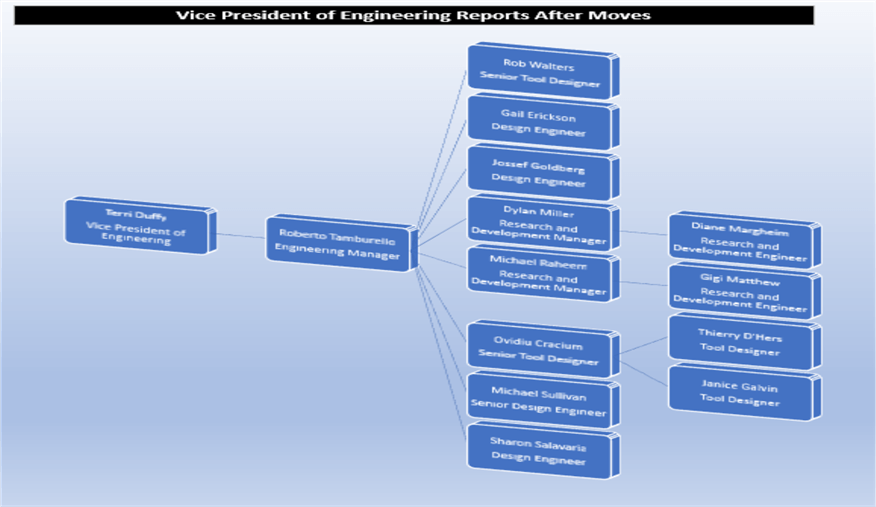
Here’s the final tutorial screen shot for creating a four-tier org chart.
- At the end of the text for Dylan Miller in the "Type your text here" dialog press the Enter key followed by the Tab key on the keyboard. This creates a new indented area and a fourth-tier org chart box.
- Copy the Name and Title text for the three direct reports to Dylan (Diane, Gigi, and Michael) to the new indented area within the "Type your text here" dialog.
- This creates three fourth-tier node boxes to the right of Dylan with unformatted Name and Title text.
- Format the text for each of the three new boxes.
- Repeat the process of creating another blank node box, copying text, and formatting text for the two direct reports to the node for Ovidiu Cracium.
- This completes the preparation of a basic org chart with four tiers of employees within the Engineering branch of the AdventureWorks organization.

Re-parenting nodes
It is important to know how to modify org charts because the employees in an organization and their reporting relationships are regularly in flux. The hierarchyid data type offers at least a couple of approaches to facilitate changing hierarchical links among employees. Changing hierarchical links means specifying that one employee node changes its parent node from an old node to a new one. This section mentions both approaches and demonstrates the basics of how to use one of the approaches.
- The GetReparentedValue method allows a developer to specify a node in an employee hierarchy so that a proposed parent node is generated to replace an existing parent node. The method does not change the node, but it does return what the new node string needs to be to change parents. In my experience, the GetReparentedValue method does not reliably return unique node values for a new parent in an employee hierarchy. This issue is documented here by another SQL Server professional and discussed generally here by Microsoft.
- The GetDescendant method can return a new unique child node hierarchyid value for any node in an employee hierarchy. You can then assign the new hierarchyid value to any prospective child node. The GetDescendant method is discussed and demonstrated for entering new hierarchical data in this prior tip. This current tip demonstrates the use of the method for re-parenting any existing node as a child of the node for which the GetDescendant method generates a fresh child node hierarchyid value.
Let’s consider a case where we want to move two employees in a hierarchy. The following table provides an overview of the employee hierarchy before and after the assignment of new parents for two employees, namely Michael Raheem and Gigi Matthew.
- In the top org chart, both Michael and Gigi report to Dylan Miller. This chart reflects the positions of Michael and Gigi before the moves for re-parenting the employees.
- In the bottom org chart, Michael gets moved so that he reports directly to Roberto Tamburello instead of to Dylan Miller. Additionally, Gigi gets moved from directly reporting to Dylan Miller. Instead, she reports directly to Michael.
| Before Moves |
|---|
 |
| After Moves |
 |
The process for implementing re-parenting based on the move of an employee consists of six steps.
- Declare the name of the employee to be moved and the name of other employees associated with the move, such as the new parent and the other children who precede and follow the moved employee for the new parent. Employee names are unique in the AdventureWorks2014 database. If each employee does not have a unique name, then you need another employee attribute, such as a primary key value from the source employee table.
- Display employee result set rows before the move consisting of the name of the employee to move, the child of the new parent before where you want to insert the employee. Step 2 combined with step 6 provides a means of verifying that re-parenting was successfully implemented.
- Declare and calculate hierarchyid values for the new position of the employee to be re-parented. If they apply, calculate the hierarchyid values for preceding and trailing children of the new parent for the re-parented employee. If the moved employee is the sole child of the node for the new parent, then there are no preceding and trailing children.
- Declare and calculate new hierarchyid value and new level value for a re-parented employee.
- Implement re-parenting for the moved employee with an update statement. Assign refreshed values to the re-parented employee for emp_OrganizationNode, OrganizationLevel, NodeString, ancestor_OrganizationNode, and ancestor_Name.
- Display employee result set rows after the move consisting of the name of the employee moved, the moved employee’s preceding child (if it applies), and the new parent. These result set rows along with those from step 2 allow you to confirm a successful re-parenting operation.
The following code listing is the T-SQL for the steps listed above. The code is designed to be executed twice.
- During the first execution, you should run the code as is. The code will re-parent the node for Michael Raheem from Dylan Miller to Roberto Tamburello.
- Next, reconfigure the code so that the code for step 1.1 is commented out. You can do this by changing –/* to /*. Also, reset the trailing comment marker for step 1.1 from –*/ to */.
- Next, reconfigure the code so that the code for step 1.2 is uncommented. Change the comment markers in the leading and trailing lines, respectively, for step 1.2 from /* to –/* and */ to –*/.
- After reconfiguration so that step 1.2 operates instead of step 1.1, re-run the script to re-parent the node for Gigi Matthew from Dylan Miller to Michael Raheem.
-- code for re-parenting nodes based on two moves
-- it is set to do the first move
-- comment out step 1.1 code and uncomment step 1.2 code to do the second move

--/*
-- step 1.1: run this change first
-- declare names for move of Michael Raheem
-- from reporting to Dylan Miller to reporting to Robert Tamburello
declare
    @Name nvarchar(101) = 'Michael Raheem'
   ,@new_parent nvarchar(101) = 'Roberto Tamburello'
   ,@child1 nvarchar(101) = 'Dylan Miller'
   ,@child2 nvarchar(101) = 'Ovidiu Cracium'
--*/

/*
-- step 1.2: run this change second
-- declare names for move of Gigi Matthew
-- from reporting to Dylan Miller to reporting to Michael Raheem
declare
    @Name nvarchar(101) = 'Gigi Matthew'
   ,@new_parent nvarchar(101) = 'Michael Raheem'
   ,@child1 nvarchar(101) = Null
   ,@child2 nvarchar(101) = Null
*/

-- step 2: before-re-parenting result set
select * from HumanResources.EmployeeDemo_whyid_wman_names where Name = @Name
union
select * from HumanResources.EmployeeDemo_whyid_wman_names where Name = @child1
union
select * from HumanResources.EmployeeDemo_whyid_wman_names where Name = @new_parent

-- step 3: declare and calculate hierarchyid values for employee before the move as well as
-- parent after the move and any other relevant children of new parent
declare
 @emp_hid hierarchyid
   =(select emp_OrganizationNode from HumanResources.EmployeeDemo_whyid_wman_names where Name = @Name)
,@new_parent_hid hierarchyid
   =(select emp_OrganizationNode from HumanResources.EmployeeDemo_whyid_wman_names where Name = @new_parent)
,@child1_hid hierarchyid
   =(select emp_OrganizationNode from HumanResources.EmployeeDemo_whyid_wman_names where Name = @child1)
,@child2_hid hierarchyid
   =(select emp_OrganizationNode from HumanResources.EmployeeDemo_whyid_wman_names where Name = @child2)

-- step 4: declare and calculate new hierarchyid value and new level value for the re-parented
-- employee
declare @new_emp_hid hierarchyid
   = @new_parent_hid.GetDescendant(@child1_hid,@child2_hid)
declare @new_emp_Org_Level int
   = @new_emp_hid.GetLevel()

-- step 5: implement re-parenting of the employee with an update statement
update HumanResources.EmployeeDemo_whyid_wman_names
set
    emp_OrganizationNode = @new_emp_hid
   ,OrganizationLevel = @new_emp_hid.GetLevel()
   ,NodeString = @new_emp_hid.ToString()
   ,ancestor_OrganizationNode = @new_parent_hid
   ,ancestor_Name = @new_parent
where emp_OrganizationNode = @emp_hid

-- step 6: after-re-parenting result set
select * from HumanResources.EmployeeDemo_whyid_wman_names where Name = @Name
union
select * from HumanResources.EmployeeDemo_whyid_wman_names where Name = @child1
union
select * from HumanResources.EmployeeDemo_whyid_wman_names where Name = @new_parent
Given that the EmployeeDemo_whyid and EmployeeDemo_whyid_wman_names tables are freshly populated, respectively, by the scripts in the "Querying and joining a table with hierarchical data to a table of relational data" and "Adding Manager Names to an employee table" sections, you can expect the following result sets from running the preceding script starting with step 1.1.
- There are two panes of output.
- The top pane is the result set for key hierarchical data rows before the move of Michael Raheem from reporting to Dylan Miller to reporting to Roberto Tamburello.
- The bottom pane is the result set for the same key hierarchical data rows after the move of Michael Raheem directly reporting to Roberto Tamburello instead of Dylan Miller.
- In the top pane, you can see that row 3 has a Name column value of Michael Raheem and an ancestor_Name column value of Dylan Miller. This configuration of column values indicates that Michael reports to Dylan at the time the rows for the top pane are generated.
- In the bottom pane, you can see that the ancestor_Name column value in row 3 changes from Dylan Miller to Roberto Tamburello.
- You should also pay attention to the fact that the emp_OrganizationNode and NodeString column values change between the top and bottom panes. Recall that hierarchyid values, such as those in the emp_OrganizationNode column, encode node string values.
- The NodeString value in the top pane’s third row is /1/1/4/3/. This string path indicates that Michael Raheem is the third direct report to Dylan Miller. You can confirm this by examining the Before Moves org chart in the preceding table.
- The NodeString value in the bottom pane’s third row is 1/1/4.1/. This string path points to an entirely new hierarchical location for Michael Raheem, who now directly reports to Roberto Tamburello. Additionally, Michael is the child node (1/1/4.1/) to Roberto Tamburello after the node for Dylan Miller (/1/1/4/).

After re-configuring the preceding script to start with step 1.2 instead of step 1.1 and running the code again, you get the following result sets.
- The top pane is from the select statement when Gigi Matthew reports to Dylan Miller, and the bottom pane is from the select statement after the update statement when Gigi’s column values are updated so that she reports directly to Michael Raheem.
- Before diving into the changed values, it may be worth commenting on why there are just two rows in the before-move and after-move result sets. Gigi is the sole child to Michael, and therefore her child1 and child2 node values are both null. When the child1 and child2 parameters for the GetDescendant method are both nulls, the new hierarchyid value is for a sole child to a parent node (that is, a child without any sibling nodes).
- The ancestor_Name column value changes from Dylan Miller in the top pane to Michael Raheem in the bottom pane. This indicates Gigi’s new direct reporting relationship after the move.
- Gigi’s new reporting relationship is also highlighted by the change in NodeString column values between the top and bottom panes.
- In the top pane showing results before the move, Gigi’s NodeString value is /1/1/4/2/. This indicates that Gigi is the second child node to Dylan Miller, who has a NodeString value of /1/1/4/.
- In the bottom pane showing results after the move, Gigi’s NodeString changes to /1/1/4.1/1/. This revised NodeString value indicates Gigi’s hierarchical position changes so that she directly reports to Michael Raheem, who has a NodeString value of /1/1/4.1/. Also, the trailing 1/ in Gigi’s NodeString indicates she is the first child node to Michael. Because Michael has no other child nodes, he does not have a second child node below him.

Next Steps
- If you do not have the AdventureWorks2014 database downloaded, consider downloading the database to make the source data readily available for the code in this tip. You can download this database from the Microsoft SQL Docs site. While I have not tested the code with OLTP AdventureWorks databases for versions of SQL Server back to SQL Server 2008, the code for this tip may work with those versions of the OLTP AdventureWorks database.
- You can create a fresh copy of the EmployeeDemo_whyid_wman_names table by running the code in the "Querying and joining a table with hierarchical data to a table of relational data" section followed by the code in the "Adding Manager Names to an employee table" section.
- Next, try running the T-SQL code in the subsequent three sections. Because the successful operation of some code depends on prior code running, consider running the code in later sections only after running the code from earlier sections.
- Take advantage of the step-by-step instructions for creating org charts in Excel based on SQL Server tables. Try especially the code in the "A query and an org chart for the direct reports to the CEO" and "A query and an org chart for a whole branch of reports to the CEO" sections.
- Then, consider designing a stored procedure to facilitate the operation of the code in the "Re-parenting nodes" section so that it can readily handle re-parenting multiple employee nodes without any manual re-configuration.
- Finally, consider inputting a table with some employee data from your organization and running code samples from this tip with your organization’s employee data. A prior tip presents the basics of creating and querying hierarchical data sources with the hierarchyid data type.
- Download a copy of the Excel spreadsheet used in this tip.

Rick Dobson is a SQL Server professional with decades of T-SQL experience that includes authoring books, running a national seminar practice, working for businesses on finance and healthcare development projects, and serving as a regular contributor to MSSQLTips.com. He has been a practicing Python developer for more than the past half decade – with a special emphasis for data visualization and ETL tasks with JSON and CSV files. His most recent professional passions include financial time series data and analyses, AI models, and statistics. If you are interested in growing your skills in any of these areas especially as they relate to financial securities, consider visiting his blog at https://securitytradinganalytics.blogspot.com/2023/12/.
- MSSQLTips Awards: Leadership (200+ tips) – 2025 | Author of the Year Contender – 2017-2024