By: Aaron Bertrand | Comments | Related: > Performance Tuning
Problem
Back when delayed durability made its debut in SQL Server 2014, I blogged about its impact on a couple of hypothetical workloads. SQL Server 2016 introduced a new dynamic management view (DMV), sys.dm_exec_session_wait_stats, which coincidentally reveals greater detail on exactly how the delayed durability feature can help individual sessions get their work done faster.
With the caveat that this feature only makes sense where a small amount of data loss is acceptable, read on to see how I used this new DMV to demonstrate that delayed durability could be beneficial for certain workloads. I’m going to show how I used this new DMV to demonstrate that delayed durability can be beneficial for certain workloads, with the caveat that this feature only makes sense where a small amount of data loss is acceptable.
Solution
We have a workload that inserts thousands of rows at a time from a flat source and deletes thousands of rows at a time after they have been processed. If either of these processes fail or there is a crash at some point, the inserts can easily be re-generated from the flat source, and the deletes simply won’t happen until the next time they are attempted. (My friend and colleague, Melissa Connors (@MelikaNoKaOi), also blogged about its usefulness while purging data.)
Of course, I am not able to just turn something like this on in a production environment and wipe my hands of it. So, I created a pair of databases in a dev environment; one to represent the existing workload, and the other to allow delayed durability on that workload:
CREATE DATABASE DDTest_Off
    ON (    name = N'DDTest_Off_data', size = 32768MB, filegrowth = 1024MB,
        filename = N'K:\SQL\Data\DD\DDTest_Off.mdf')
LOG ON (    name = N'DDTest_Off_log',  size = 16384MB, filegrowth = 1024MB,
        filename = N'J:\SQL\Data\DD\DDTest_Off.ldf');
GO
CREATE DATABASE DDTest_On
    ON (    name = N'DDTest_On_data',  size = 32768MB, filegrowth = 1024MB,
        filename = N'K:\SQL\Data\DD\DDTest_On.mdf')
LOG ON (    name = N'DDTest_On_log',   size = 16384MB, filegrowth = 1024MB,
        filename = N'J:\SQL\Data\DD\DDTest_On.ldf');
GO
ALTER DATABASE DDTest_On SET DELAYED_DURABILITY = ALLOWED;
In each database, I created the following table:
CREATE TABLE dbo.TheTable
(
  TheID   int              IDENTITY(1,1) PRIMARY KEY,
  TheDate datetime         NOT NULL DEFAULT CURRENT_TIMESTAMP,
  RowGuid uniqueidentifier NOT NULL DEFAULT NEWID()
);
And two procedures to simulate a certain (though grossly simplified) workload:
CREATE PROCEDURE dbo.AddSomeData
  @Iterations int = 1000
AS
BEGIN
  SET NOCOUNT ON;
  DECLARE @i int = 1;
  WHILE @i <= @Iterations
  BEGIN
    BEGIN TRANSACTION;
    INSERT dbo.TheTable(TheDate)
      SELECT TOP (1000) sysdatetime()
      FROM sys.all_columns AS s;
    COMMIT TRANSACTION -- WITH (DELAYED_DURABILITY = ON);
    --                 ^^ not commented out in DDTest_On
    SET @i += 1;
  END
END
GO
CREATE PROCEDURE dbo.DeleteSomeData
  @Iterations int = 1000
AS
BEGIN
  SET NOCOUNT ON;
  DECLARE @i int = 1;
  WHILE @i <= @Iterations
  BEGIN
    BEGIN TRANSACTION;
    DELETE TOP (1000) dbo.TheTable;
    COMMIT TRANSACTION -- WITH (DELAYED_DURABILITY = ON);
    --                 ^^ not commented out in DDTest_On
    SET @i += 1;
  END
END
GO
The goal was to run the following four tests, with both 8 and 16 concurrent sessions:
- INSERT workload with delayed durability OFF
- INSERT workload with delayed durability ON
- DELETE workload with delayed durability OFF
- DELETE workload with delayed durability ON
While these procedures were running, inserting or deleting 8MM or 16MM rows, I wanted to capture some metrics about both the system and the specific sessions. I followed this sequence:
- Capture the log’s virtual file stats before any workload started
- Start a loop collecting wait stats per session every few seconds
- Start 1 iteration of the workload using 8 or 16 threads in SQLQueryStress
- "Register" the SPID before running the workload
- Run the workload
- "Deregister" the SPID
- Stop the loop collecting wait stats
- Capture the log’s virtual file stats after the workload finished
In my Utility database, I created the following
objects. First, a schema for separation for other utility objects:
USE Utility;
GO
CREATE SCHEMA DD AUTHORIZATION dbo;
GO
Next, an empty table to capture virtual file stats:
SELECT TOP (0)
  TestID     = CONVERT(tinyint, 1),
  StepID     = CONVERT(tinyint, 1),
  EventTime  = sysdatetime(),
  *
INTO DD.FileStats
FROM sys.dm_io_virtual_file_stats(DB_ID('model'), 2);
GO
And the procedure to capture the virtual file stats at the beginning (step 2) and again at the end (step 5):
CREATE PROCEDURE DD.LogFileStats
  @TestID tinyint,
  @StepID tinyint
AS
BEGIN
  INSERT DD.FileStats
    SELECT @TestID, @StepID, sysdatetime(), *
    FROM sys.dm_io_virtual_file_stats
    (DB_ID(CASE WHEN @TestID IN (1,3) THEN 'DDTest_Off' ELSE 'DDTest_On' END), 2);
END
GO
Next, an empty table to capture wait stats from the session-specific DMV:
SELECT TOP (0)
  TestID     = CONVERT(tinyint, 1),
  EventTime  = sysdatetime(),
  *
INTO DD.WaitStats
FROM sys.dm_exec_session_wait_stats;
And the procedure that will log these in a loop:
CREATE PROCEDURE DD.LogWaitStats
  @TestID tinyint
AS
BEGIN
  WHILE 1 = 1
  BEGIN
    INSERT DD.WaitStats
      SELECT @TestID, sysdatetime(), *
        FROM sys.dm_exec_session_wait_stats
       WHERE session_id IN
       (
         SELECT SessionID
           FROM DD.RunningSPIDs
          WHERE EndTime IS NULL
       );
    WAITFOR DELAY '00:00:03';
  END
END
GO
Followed by an empty table to monitor processes from the workload:
CREATE TABLE DD.RunningSPIDs
(
  TestID     tinyint,
  SessionID  int,
  StartTime  datetime2 NOT NULL DEFAULT sysdatetime(),
  EndTime    datetime2
);
And procedures to register / deregister those processes:
CREATE PROCEDURE DD.RegisterSPID
  @TestID tinyint
AS
BEGIN
    INSERT DD.RunningSPIDs(SessionID, TestID)
      SELECT @@SPID, @TestID
      WHERE NOT EXISTS
      (
        SELECT 1 FROM DD.RunningSPIDs
        WHERE TestID    = @TestID
          AND SessionID = @@SPID
          AND EndTime   IS NULL
      );
END
GO
CREATE PROCEDURE DD.DeregisterSPID
  @TestID tinyint
AS
BEGIN
    UPDATE DD.RunningSPIDs
       SET EndTime   = sysdatetime()
     WHERE TestID    = @TestID
       AND SessionID = @@SPID
       AND EndTime   IS NULL;
END
GO
Running the tests
For example, for test 1, where we are adding data using 8 threads to the database with delayed durability off, the sequence is as follows:
- First, I called the following in a query window:
EXEC Utility.DD.LogFileStats @TestID = 1, @StepID = 10;
EXEC Utility.DD.LogWaitStats @TestID = 1;
-- EXEC Utility.DD.LogFileStats @TestID = 1, @StepID = 20;
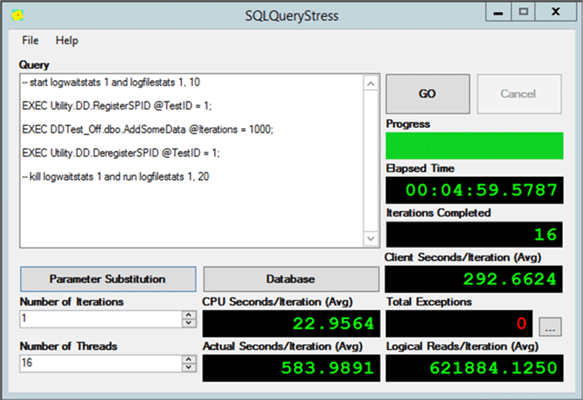
- Then, I started SQLQueryStress with 1 iteration, 8 threads, and the following
batch:
-- a comment to remind me to perform step 1

-- When a process starts up to run the workload,
-- call the following procedure to register a SPID:

EXEC Utility.DD.RegisterSPID @TestID = 1;

-- Then they would run the procedure that adds the data:

EXEC DDTest_On.dbo.AddSomeData @iterations = 1000;

-- Then deregister themselves:

EXEC Utility.DD.DeregisterSPID @TestID = 1;

-- a comment to remind me to perform step 3
- When all of the threads finished, I manually stopped the query window where
the waits were being collected, and then called the commented portion to log
the "after" information from virtual file stats:
EXEC Utility.DD.LogFileStats @TestID = 1, @StepID = 20;
I repeated for 7 more tests, then analyzed. After I completed the tests with
16 threads, I copied the data from each table to a shadow table (e.g.
DD.LogFileStats16Threads) just to keep them separate.
Then I repeated the same for the 8 thread tests.
Analyzing the results
It took a little time to sift through all the stats I collected to determine what would be meaningful to share. The major differences between any of the workloads comparing when delayed durability was on to when it was off were:
- Total writes and write stalls to the log file (total amount of data written didn’t vary)
- Average WRITELOG waits (most other waits were within nominal variance)
- Average duration it took each thread to run its workload
I wrote this big, Canada Goose honking aggregation query to put this together in a nice little result set for me:
;WITH LogFileStats AS
(
  SELECT Threads, TestID, TotalWrites, TotalWriteStall_ms FROM
  (
    SELECT Threads = 16, TestID, StepID,
        TotalWrites = num_of_writes - LAG(num_of_writes, 1)
          OVER (PARTITION BY TestID ORDER BY StepID),
        TotalWriteStall_ms = io_stall_write_ms - LAG(io_stall_write_ms, 1)
          OVER (PARTITION BY TestID ORDER BY StepID)
      FROM DD.FileStats16Threads
    UNION ALL
    SELECT Threads = 8,  TestID, StepID,
        num_of_writes - LAG(num_of_writes, 1)
          OVER (PARTITION BY TestID ORDER BY StepID),
        io_stall_write_ms - LAG(io_stall_write_ms, 1)
          OVER (PARTITION BY TestID ORDER BY StepID)
      FROM DD.FileStats8Threads
  ) AS x WHERE StepID = 20
),
WritelogWaitStats (Threads, TestID, AvgWritelogWaits_ms) AS
(
  SELECT Threads, TestID, CONVERT(decimal(10,2),AVG(1.0 * HighestWait)) FROM
  (
    SELECT Threads = 16, session_id, TestID, HighestWait = MAX(wait_time_ms)
      FROM DD.WaitStats16Threads WHERE wait_type = 'WRITELOG'
      GROUP BY session_id, TestID
    UNION ALL
    SELECT Threads = 8,  session_id, TestID, HighestWait = MAX(wait_time_ms)
      FROM DD.WaitStats8Threads WHERE wait_type = 'WRITELOG'
      GROUP BY session_id, TestID
  ) AS y GROUP BY Threads, TestID
),
WorkloadDurations (Threads, TestID, AvgDuration_s) AS
(
  SELECT Threads = 16, TestID, AVG(1.0*DATEDIFF(SECOND, StartTime, EndTime))
    FROM DD.RunningSPIDs16Threads GROUP BY TestID
  UNION ALL
  SELECT Threads = 8, TestID, AVG(1.0*DATEDIFF(SECOND, StartTime, EndTime))
    FROM DD.RunningSPIDs8Threads  GROUP BY TestID
)
SELECT Test = CASE WHEN l.TestID < 3 THEN 'Insert' ELSE 'Delete' END
    + ', ' + RTRIM(l.Threads) + ' threads, DD = '
    + CASE l.TestID % 2 WHEN 1 THEN 'OFF' ELSE 'ON' END,
  l.TotalWrites, l.TotalWriteStall_ms, w.AvgWritelogWaits_ms,
  AvgDuration_s = CONVERT(decimal(10,2), d.AvgDuration_s)
FROM LogFileStats AS l
INNER JOIN WritelogWaitStats AS w
  ON  l.Threads = w.Threads AND l.TestID  = w.TestID
INNER JOIN WorkloadDurations AS d
  ON  l.Threads = d.Threads AND l.TestID  = d.TestID
ORDER BY l.Threads, l.TestID;
The initial results look like this:
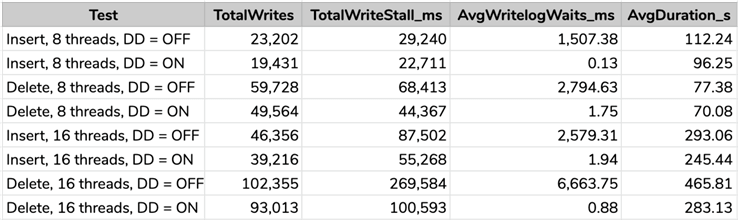
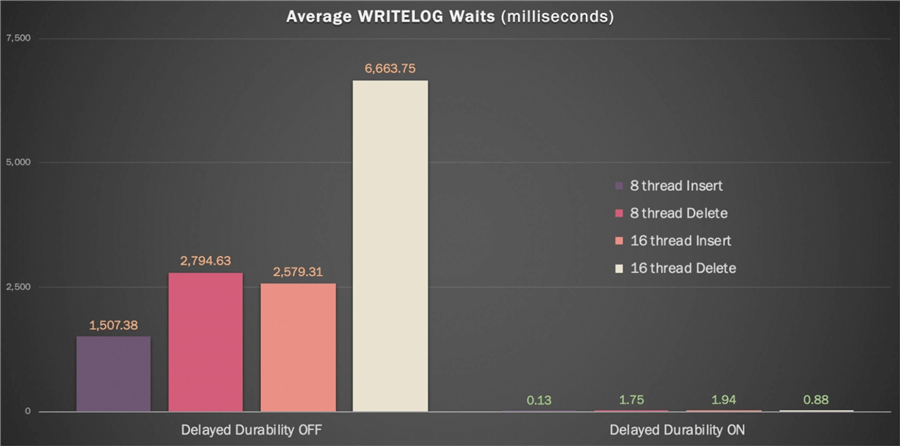
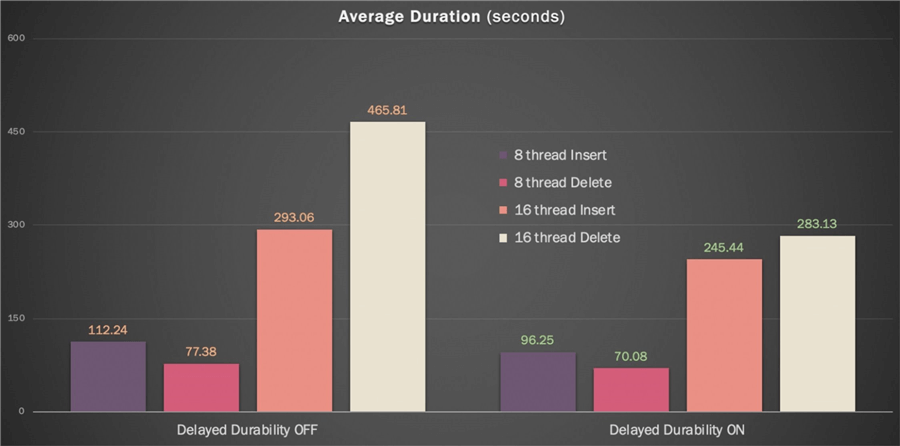
You can see the trends that highlight the benefits of using delayed durability if you scan visually: fewer overall log writes, much less time spent on write stalls, almost no WRITELOG waits, and a lower average duration. We can look at those latter two metrics on the following charts:
A couple of caveats:
- This was on a server with very fast I/O (Dell XtremIO). You can imagine that any effects on stalls, waits, and duration I’ve observed here might be much more pronounced on a less capable disk subsystem.
- Even with delayed durability, a system will still experience WRITELOG waits, since logging has to happen eventually. So, don’t expect them to disappear at the instance level; the key is simply that your highly transactional workload is no longer waiting.
Conclusion
It is clear that delayed durability can provide benefits to a write-heavy workload, especially one where WRITELOG waits are already prevalent. If you have a system where your workload is largely purging, or where the data could be easily rebuilt from other sources in the event of a disaster (e.g. this is not your only copy), it may be worth considering testing this feature. I may not have captured the exact metrics you are interested in seeing for your workload, as you may be after other troublemakers, like disk waits in general or log flush rates. But I hope I’ve described how you can set up your own tests, slice the data in a way that makes sense for you, so you can best tune for your most troublesome bottlenecks. The session-level wait stats DMV really gives you an extra layer of analysis to help you see the precise impacts of this feature (or any feature, really).
Next Steps
Read on for related tips and other resources:
- Reduce SQL Server WRITELOG waits using Delayed Durability
- Delayed Durability while Purging Data
- Delayed Durability in SQL Server 2014
- Delayed Durability in SQL Server 2014 – Part 3 – When should I use it?
- Control Transaction Durability
- sys.dm_exec_session_wait_stats (Transact-SQL)
- Troubleshooting SQL Server Transaction Log Related Wait Types
- How to Identify I/O Bottlenecks in MS SQL Server


About the author
 Aaron Bertrand (@AaronBertrand) is a passionate technologist with industry experience dating back to Classic ASP and SQL Server 6.5. He is editor-in-chief of the performance-related blog, SQLPerformance.com, and also blogs at sqlblog.org.
This author pledges the content of this article is based on professional experience and not AI generated.
View all my tips
