Problem
There is a common belief that any application, like anything in the real world, is not ideal and there is always something to develop, make it better, and more competitive. Particularly, in development environments, the code is usually changed more often in order to fix the issues, meet the business goals, increase performance, and so on. Therefore, for many developers, researching problems, understanding issues, and fixing bugs are part of their daily routines. For database-based applications, sometimes it is difficult to understand whether the problem is on the database side or on the application side. In such cases, database and application developers should cooperate to easily analyze, locate, and solve the problem. In this article, I will share my experience of researching the problems with SQL Server stored procedures using SQL Server Profiler.
Solution
It is assumed that our application accesses the database only by making stored procedure calls. Thus, to find a problem, we need to analyze the calls of the corresponding stored procedure(s). Below, will be described how to use SQL Server Profiler to easily capture a specific stored procedure call and avoid capturing unnecessary information in the profiler. Having only the necessary information about the procedure call, will make the debugging process simpler and faster. Well, we are going to illustrate this process by a case study. Let’s begin with creating a test environment:
USE master
GO

CREATE DATABASE TestDB
GO

USE TestDB
GO

CREATE TABLE TestTable
(
  ID INT PRIMARY KEY,
  Val CHAR(1)
)
GO

INSERT INTO TestTable(ID, Val)
VALUES (1,'A'),(2,'B'),(3, 'C')
We have created a sample database with a sample table. Now, we will create a couple of stored procedures that are called by an application to fill and retrieve data. The first one is called by the application to insert data into TestTable:
CREATE PROCEDURE uspInsertData
   @pID INT,
   @pVal CHAR(1),
   @ResCode VARCHAR(10) OUTPUT
AS
BEGIN
   BEGIN TRY

      BEGIN TRANSACTION

      INSERT INTO TestTable(ID, Val)
      VALUES (@pID, @pVal)

      COMMIT

   END TRY
   BEGIN CATCH

      IF @@TRANCOUNT > 0
         ROLLBACK

   END CATCH

   SET @ResCode='OK'

END
GO
The second procedure gets the row from the table by its value:
USE TestDB
GO

CREATE PROCEDURE uspGetData
   @pVal CHAR(1)
AS
BEGIN

   SELECT ID, Val
   FROM TestTable
   WHERE Val=@pVal
END
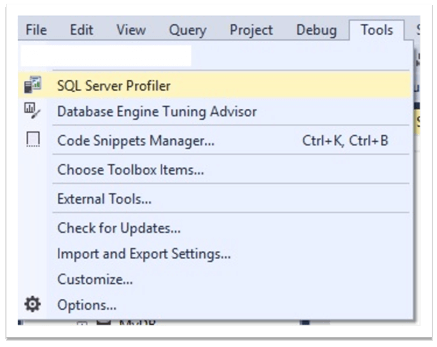
Now, let’s assume that one of the application developers reports that he is trying to insert data into the table and receives "OK" from the database. However, when he searches data by the inserted value, he receives nothing. As we know that "uspInsertData" procedure is called to insert a row into the table, we will start SQL Server Profiler to catch this procedure call and ask the developer to reproduce the issue. To do so, we open SQL Server Management Studio (SSMS) and choose "Tools" > "SQL Server Profiler":
When Profiler starts, we connect to our instance:

After that, the window "Trace Properties" is opened:

Here, we should choose the appropriate template for our task. Each template provides a group of events aimed at a specific purpose. As we need to trace only a specific procedure call and do not need any additional information, we are interested only in gathering the information about our stored procedure call. Thus, at this step, the question is which template we need to choose. Actually, we can catch information about a stored procedure call using almost any template. However, as our procedures are called from the application side, we deal with remote procedure calls. Therefore, we are interested in capturing RPC (Remote Procedure Call) events. For instance, we can choose "Standard (default)" template, then uncheck some unnecessary events and leave only remote stored procedures related ones:

In our particular example, we can leave only "RPC:Completed". For choosing only "RPC:Completed" event without spending time on unchecking others, we can also use a blank template and check only the corresponding event:

While researching remote stored procedure calls, I personally prefer to choose "Tuning" template for analyzing such kind of tasks as there are quite a few events mainly related to stored procedures. Therefore, we do not need to manually uncheck anything when choosing this option:

To catch a specific stored procedure, we choose "Column Filters…" and set the "TextData" filter. If we do not know the procedure’s full name, we can just type only a part of it:

After setting the filter, we click "Run" to start the trace:

Having the trace running, we ask the developer to reproduce the problem. When he performs an action that calls our stored procedure, we can find the call on the profiler. In our example, we can find the execution code of our procedure in "RPC:Completed":

Thus, we have captured the necessary stored procedure call. Now, let’s pause the trace, copy the execution code, and paste it on SSMS to analyze:
declare @p3 varchar(10)
set @p3='OK'
exec "TestDB"."dbo"."uspInsertData";1 @pID=3,@pVal=N'D',@ResCode=@p3 output
select @p3
If we execute the code above in SSMS, we can see that the procedure returns "OK":

Nevertheless, if we try to select rows with Val=D, we will receive nothing:
USE TestDB
GO

EXEC uspGetData
@pVal = N'D'
GO

Well, to find the problem, we start debugging the captured call of the stored procedure:

We can see that the procedure is rolled back. This is because we are trying to insert a duplicate ID into the table, which is unique. Additionally, it is clear from the debugging that the procedure is designed in a wrong way and always returns ‘OK’ (even when it fails). Hence, the issue is found and we can fix it by modifying the stored procedure:
ALTER PROCEDURE uspInsertData
   @pID INT,
   @pVal CHAR(1),
   @ResCode VARCHAR(10) OUTPUT
AS
BEGIN
   BEGIN TRY

      BEGIN TRANSACTION

      INSERT INTO TestTable(ID, Val)
      VALUES (@pID, @pVal)

      COMMIT

      SET @ResCode='OK'

   END TRY
   BEGIN CATCH

      IF @@TRANCOUNT > 0
         ROLLBACK

      SET @ResCode='Error'

   END CATCH

END
GO
Now, developers will receive the correct message about the procedure’s result:

This is a very simple example, but the step-by-step illustrates how SQL Server Profiler can be used to capture a stored procedure call which is often essential in fixing database related problems. Despite the fact that in real-world situations, cases are usually much more complicated, we can capture procedure calls in the same simple way and then analyze them using the debugger.
Conclusion
In conclusion, SQL Server Profiler is a powerful tool for tracing stored procedure calls. The captured procedure call can be helpful in finding problems. The majority of Profiler’s predefined templates are provided with the events related to stored procedures. Particularly, SQL Server Profiler’s predefined "Tuning" template can be very useful if we need to capture only remote stored procedure calls. Additionally, the column filter "TextData" can be used to find a stored procedure by its name (or by a part of its name) and trace only the calls of that procedure. Hence, we will be able to trace only the call of a particular stored procedure and avoid the generation of additional, unnecessary information.
Next Steps
To find more information about SQL Server Profiler, please follow the links below:
- More Profiler tips on MSSQLTips
- https://docs.microsoft.com/en-us/sql/tools/sql-server-profiler/sql-server-profiler?view=sql-server-ver15
- https://docs.microsoft.com/en-us/sql/tools/sql-server-profiler/sql-server-profiler-templates?view=sql-server-ver15
- https://docs.microsoft.com/en-us/sql/tools/sql-server-profiler/start-sql-server-profiler?view=sql-server-ver15

Sergey Gigoyan (LinkedIn) is a Senior Technical Architect specializing in data and databases with more than 15 years of experience. Sergey focuses on modern data architectures, database design and development, performance tuning and optimization, high availability solutions, BI development and DW design. He has worked with SQL Server, Oracle, and PostgreSQL databases, as well as cloud-based data solutions (AWS and Azure). Sergey also has extensive experience with modern data stacks such as Snowflake and dbt.
Sergey’s experience spans various industries. He had the privilege of working with IT giants such as Oracle as a Principal Data Engineer and BlackBerry as well as innovative startups. He helped deliver complex database solutions and advanced data strategies.
Sergey is also the author of “Building a Successful Career in IT – How I Did It” where he provides actionable advice on thriving in the ever-evolving IT industry.
- MSSQLTips Awards: Champion (100+ tips) – 2024 | Author of the Year – 2020