Problem
In part 1 of this series about Power BI optimization, I demonstrated how implementing Vertical Filtering and preference for custom columns created in Power Query could help improve performance of Power BI reports. In this second part of the series I will demonstrate how disabling “Auto date/time” and using more variables in DAX measures calculations could be used to optimize Power BI reports performance. I would encourage you to read Part 1 of this series to ensure you understand all discussed options available for performance optimization in Power BI.
Solution
This part of the series will focus on what issues can be resolved by “Auto date/time” and try using more variables in DAX measures calculations options as mentioned above.
Disable “Auto date/time” in data load options settings
The main purposes of the auto date/time are to support convenient time intelligence reporting based on the date columns loaded into the data model. I will not go into more detail as to what goes on behind the scene if auto date/time is enabled in Power BI desktop, you can read more on this here. However, I will be demonstrating how it might be affecting performance and a best practice on this.
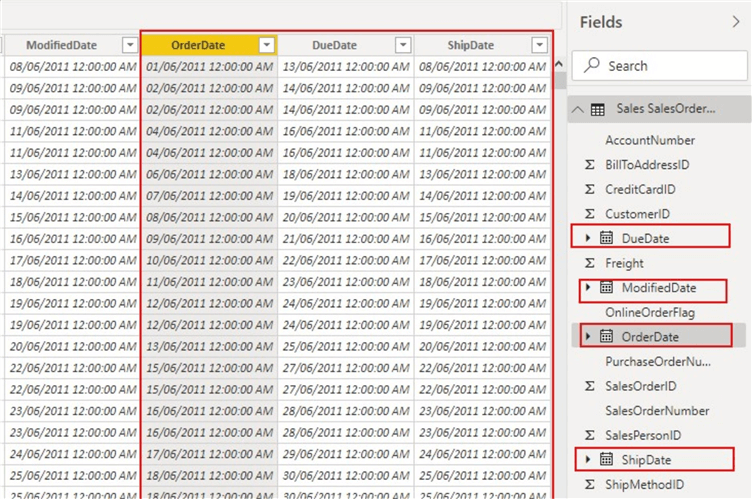
I have imported the “SalesOrderHeader” table from AdventureWorks2014 database for the purpose of this demo. Note that the table has four datetime columns as shown in the diagram below.
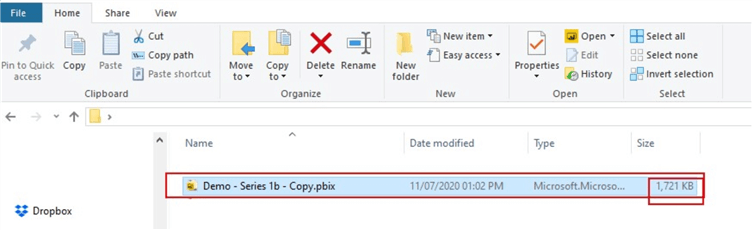
So, when this model is saved to a file location, I can view the size of the model as seen below showing size as 1,721KB currently.
Usually, most model sizes are usually higher than this, thus it becomes necessary to reduce the model size for optimization purposes by disabling the “Auto date/time” in the data load options settings. We can configure this in either of two ways (Globally or Current File). If done globally, it would only affect new files imported to the model and, if on the other hand done on the current file it would affect the current files in the model. More information on Global and Current File can be researched here.
For this demo I have applied configuration using the Current File option as can be seen in the following diagrams. Click on “File“.

Then select “Options and Settings” then “Options“.

The next two diagrams show the Global option and the Current File Option for configuring the “Auto date/time” options.


After unchecking the “Auto date/time” option in the Current File data load section, click “Ok“. Then if you check, you can now see that the calendar symbol at the back of the DateTime columns in the SalesOrderHeader table have all vanished as seen in the diagram below.

Then save your report as usual and go back to the location where the PBIX was saved earlier, it can now be seen that the model size has reduced from 1,721KB to about 1,697KB, a difference of about 24KB. Note that this could be higher depending on your model and this is even much more effective in larger models. See image below.

Using more variables in DAX measures calculations
Among the importance of variables in Power BI data models include improved performance, reduced complexity, improved readability, and simplified debugging. However, this tip is solely looking at use of variables for improving performance only. You can get more information on other benefits of variables here.
To demonstrate how the use of variables can help optimize Power BI models (particularly the refresh time of visuals), I have again used the imported SalesOrderHeader table from AdventureWork2014. I have created same DAX calculated measure in two different ways, one with variables and the other without variables. Both measures are used to calculate Year on Year Growth in total Orders made. The calculated measures are as follows.

Orders YoY Growth (Without Variables) =
DIVIDE (
    ( [Total Orders] - CALCULATE ( [Total Orders], PARALLELPERIOD ( DateTable[Date], -12, MONTH ) ) ),
    CALCULATE ( [Total Orders], PARALLELPERIOD ( DateTable[Date], -12, MONTH ) )
)

Orders YoY Growth (With Variables) =
VAR _OrdersPriorYear =
    CALCULATE ( [Total Orders], PARALLELPERIOD ( DateTable[Date], -12, MONTH ) )
VAR _OrdersVariance =
    DIVIDE (([Total Orders] - _OrdersPriorYear), _OrdersPriorYear)
RETURN
    _OrdersVariance
Besides the fact that the measure without variables is inefficient because it requires Power BI to evaluate the same expression twice, it also would take more time to render in a visual as it takes more time to refresh.
The second measure expression is more efficient because it only evaluates the expression once because of variables in it. Also, it takes a shorter time to render in a visual as it usually takes a shorter time to refresh.
To demonstrate the effects of variables on refresh time, I have used Performance Analyzer in Power BI Desktop to show this as follows.

The diagram above shows that the measure without variables took about 170 milliseconds to refresh the card visual. The bulk of the time was used by the “Other” time required by the slicer visual for preparing queries, waiting for other visuals to complete, or performing other background processing.

The diagram above shows that the measure with variable took a shorter time of 127 milliseconds to refresh the same card visual. The time taken to render the visual and the time required by the slicer visual for preparing queries, waiting for other visuals to complete, or performing other background processing was also smaller than that of the measure expression without variables.
When troubleshooting performance issues, it can be helpful to further investigate the issues on external tools like DAX Studio, which can really provide more information on where to focus your efforts to resolve performance issues. I will create another tip on how to investigate performance issues using DAX Studio.
Next Steps
- Checkout the first part of this series of improving performance of Power BI model.
- You can get more information on data reduction techniques here.
- Learn more about benefits of using variables in optimizing Power BI models here.
- Try this tip out with your own data as business requires.

Kenneth A. Omorodion is a Microsoft Certified Solutions Associate (MCSA) with 12+ years of enterprise application experience in Power BI, DAX, Microsoft Fabric, Business Intelligence, data warehousing, SSRS, T-SQL, and Azure. Beyond his technical skills, Kenneth has expertise working with stakeholders’ and business leaders to help them better understand key insights. He has a great track record of successfully delivering full life cycle Business Intelligence and data solutions to organizations with measurable business impact.
- MSSQLTips Awards
- Achiever Award (75+ Tips) – 2025
- Author of the Year-2021
- Author Contender-2022/2023/2024


