By: Scott Murray | Comments | Related: > Reporting Services Development
Problem
There are several things that we need to do over and over again in SSRS reports, so having a common set of code to use for these things can be helpful. In this tip we look at SSRS code you can use to handle divide by zero, color schemes, use of special characters and more.
Solution
SQL Server Reporting Services, SSRS, remains a key component of any organizations reporting infrastructure. Even with new tools such as Power BI, SSRS is still a mainstay tool for generating paginated reports. These reports provide a uniform view for reports that are printed or are exported to PDF, Excel, or Word. With continued emphasis on maintaining such standard formats, there are several common code or feature hacks or hints that help to achieve maximum efficiency when designing reports.
Sometimes when working with a tool for a long time, we may miss some easy or effective ways to hack or code a functional requirement for a report. Alternatively, it could be there is a "hard" or inflexible way to complete a report feature, but an alternative could exist that is much more flexible or easier to manage or change in the future.
Within this article, we will explore several tips to achieve success and efficiency within our SSRS report development.
Using custom code is the number one "coding" method that can achieve efficiencies and address issues that surface with attempting to accomplish stated user requirements. Some folks do not like to go outside the normal SSRS toolset; however, using SSRS custom code, we will cover several different code sets that can be used to achieve a goal that is not readily available or manageable in SSRS.
SSRS Code to Handle Divide By Zero and Display of Values
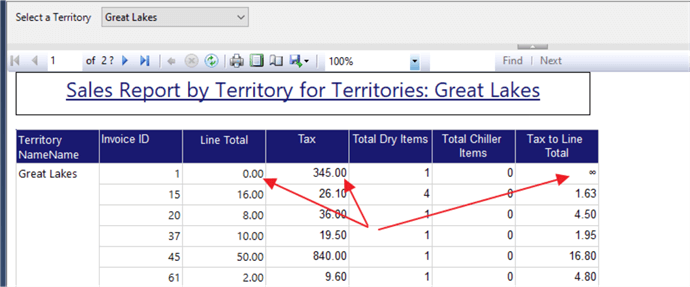
The first code we will show covers situations where two numbers are being divided which, at times, results in a divide by zero error. For quite some time, I struggled with showing percentages on a report when that percentage was the ratio of two figures and the denominator in that ratio happened to be zero. That situation certainly produces a divide by zero error which is displayed as an Error on a report. Most report users hate to see the word "Error" , the # sign, or the infinity sign (sideway 8) on a report; an example is shown below by dividing the tax amount by the line total; folks would wonder what the infinity symbol means.
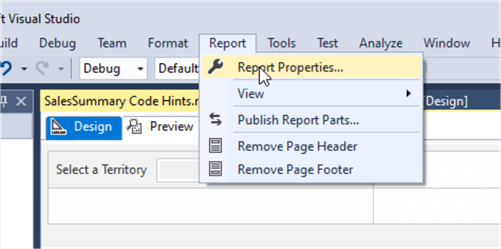
To add custom code to the report, we need to go to the Report Properties via Report > Report Properties. (Note in VS 2019, you will find the Report Properties under Extensions)
Once in the report properties window, the Code tab must be selected.
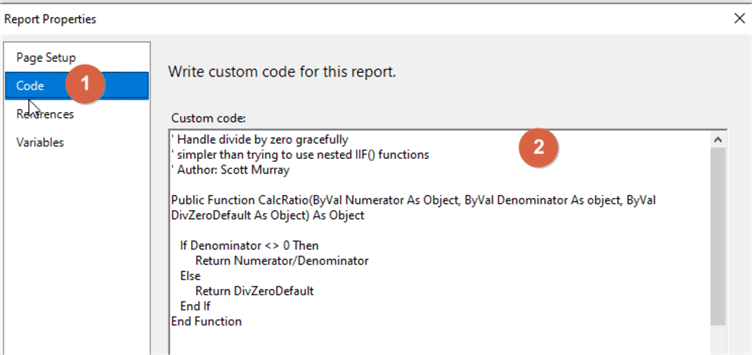
In the custom code window, we can easily add the following code to handle the divide by zero problem.
'*************************************************************************
' Handle divide by zero gracefully
' Author: Scott Murray
'*************************************************************************
Public Function CalcRatio(ByVal Numerator As Object, ByVal Denominator As object, ByVal DivZeroDefault As Object) As Object

   If Denominator <> 0 Then
        Return Numerator/Denominator
   Else
        Return DivZeroDefault
   End If
End Function
Then, within a textbox we can call that code using a formula like the one shown below:
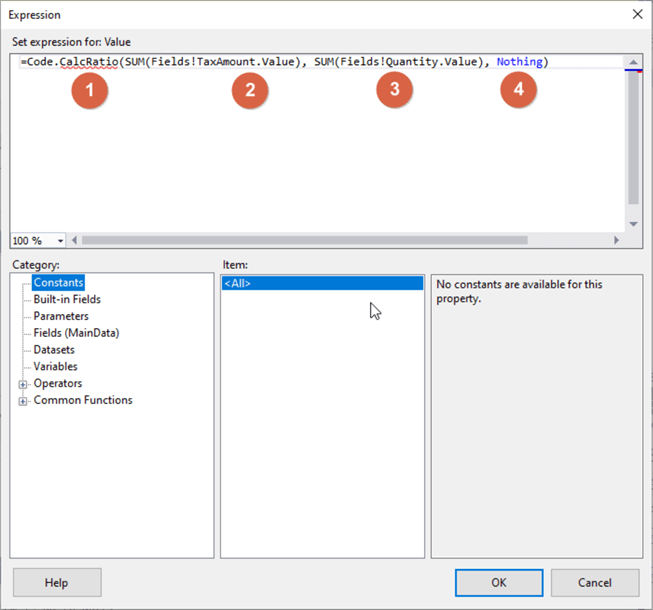
This results in the following report. The first and second argument in the code are the numerator and denominator, but the third item determines what is displayed when a divide by zero results. In this example, nothing is displayed. We could have easily had the value be 0 with the expression above.
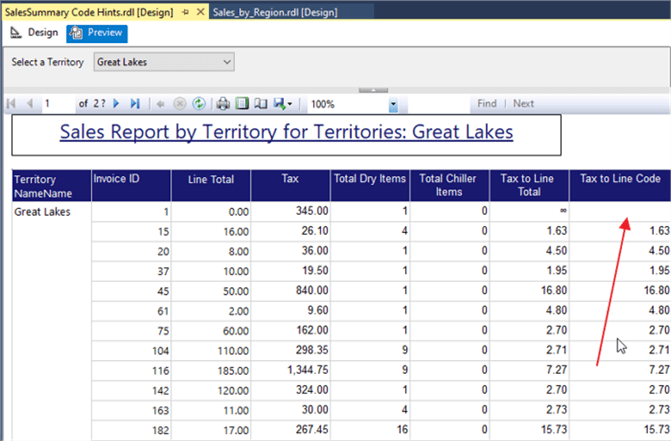
SSRS Code to Set Color Scheme
Using custom code to establish a set color scheme is a common practice. You can see these tips related setting custom colors: Different ways to create Custom Colors for Charts in SQL Server Reporting Services and SQL Server Reporting Services Custom Code Assemblies . However, most of those use a fixed interval range set, such as 0 to 10, 10 to 20, etc. What happens if the values do not fit into these fixed range of numbers or if the numeric values are ever increasing? Custom code can again help us solve this particular problem with just a bit of help from a SQL query.
Continuing with our example data, we will now set the background color for the Tax column. Since this amount can vary greatly, we actually need to calculate the maximum and minimum tax amount for the selected Sales Territory. Thus we want to generate a single maximum and minimum tax amount for the report. The maximum Tax Amount value will be passed to the custom code to set the color.
SELECT MIN(Sales.InvoiceLines.TaxAmount) AS TaxAmount_MIN
   ,MAX(Sales.InvoiceLines.TaxAmount) AS TaxAmount_MAX
FROM Sales.InvoiceLines
INNER JOIN Sales.Invoices
   ON Sales.InvoiceLines.InvoiceID = Sales.Invoices.InvoiceID
INNER JOIN Sales.Customers AS Customers_1
   ON Sales.Invoices.CustomerID = Customers_1.CustomerID
      AND Sales.Invoices.BillToCustomerID = Customers_1.CustomerID
INNER JOIN Application.Cities AS Cities_1
   ON Customers_1.DeliveryCityID = Cities_1.CityID
      AND Customers_1.PostalCityID = Cities_1.CityID
INNER JOIN Application.StateProvinces AS StateProvinces_1
   ON Cities_1.StateProvinceID = StateProvinces_1.StateProvinceID
      AND Cities_1.StateProvinceID = StateProvinces_1.StateProvinceID
      AND Cities_1.StateProvinceID = StateProvinces_1.StateProvinceID
INNER JOIN Application.Countries AS Countries_1
   ON StateProvinces_1.CountryID = Countries_1.CountryID
      AND StateProvinces_1.CountryID = Countries_1.CountryID
      AND StateProvinces_1.CountryID = Countries_1.CountryID
INNER JOIN Sales.CustomerCategories
   ON Customers_1.CustomerCategoryID = Sales.CustomerCategories.CustomerCategoryID
      AND Customers_1.CustomerCategoryID = Sales.CustomerCategories.CustomerCategoryID
      AND Customers_1.CustomerCategoryID = Sales.CustomerCategories.CustomerCategoryID
WHERE (StateProvinces_1.SalesTerritory IN (@pTerritory))
The below code is added to the custom code set; we pass two arguments to this public function. The first is the actual value and the second is the maximum value from the above query.
Next, two variables are created, the first one, BackgroundColor, for the resulting background color and the second, MeasureMaxThreshold, is used in the calculation for determining the intervals for each color.
In the below example, we create 5 intervals, but you could use any number of intervals, as long as a color is defined for each interval. To make this determination, we use the maximum amount and divide it by 5. Interval 1 is then from 0 (or less) to the maximum amount divided by 5; we assign the color of MediumSeaGreen to this interval. Next, the interval 2 value is set by multiplying the interval value * 2; it goes from the interval 1 value to the interval 2 calculation (Maximum value divided by 5 and then multiplied by 2). These intervals continue until we get to the value for interval 4. Anything greater than that value is assigned a fixed color.
In the below code, If/ElseIf/Else syntax is used to evaluate the value and assign a color.
' Define background color on data with no set high and low values ' Author: Scott Murray

Public Function BG_Color_HOLD (ByVal Measure AS Decimal,  ByVal MeasureMax AS Decimal)

DIM BackgroundColor As String
DIM MeasureMaxThreshold AS Decimal

MeasureMaxThreshold = MeasureMax /5
   If Measure <= MeasureMaxThreshold THEN
            BackgroundColor ="MediumSeaGreen"
     ELSEIF Measure > MeasureMaxThreshold AND Measure <= MeasureMaxThreshold*2 THEN
            BackgroundColor ="PaleGreen"
   ELSEIF Measure > MeasureMaxThreshold*2  AND Measure <= MeasureMaxThreshold*3 THEN
            BackgroundColor =  "Yellow"
   ELSEIF Measure > MeasureMaxThreshold*3  AND Measure <= MeasureMaxThreshold*4  THEN
            BackgroundColor ="LightCoral"
   ELSE BackgroundColor = "Red"
   END IF

   RETURN BackgroundColor
End Function
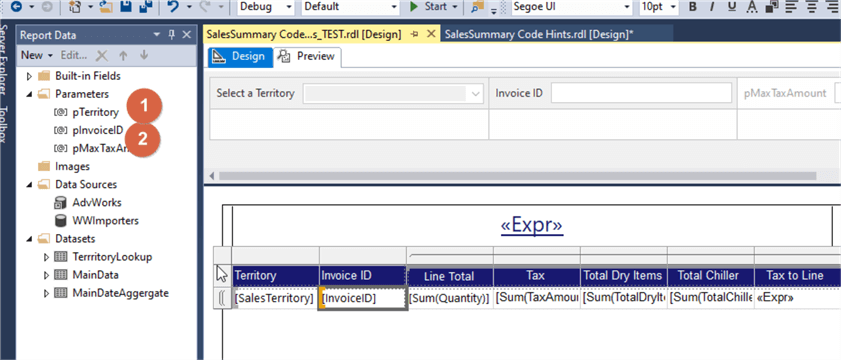
The next step in the setup process includes creating a parameter to hold our maximum tax amount value.
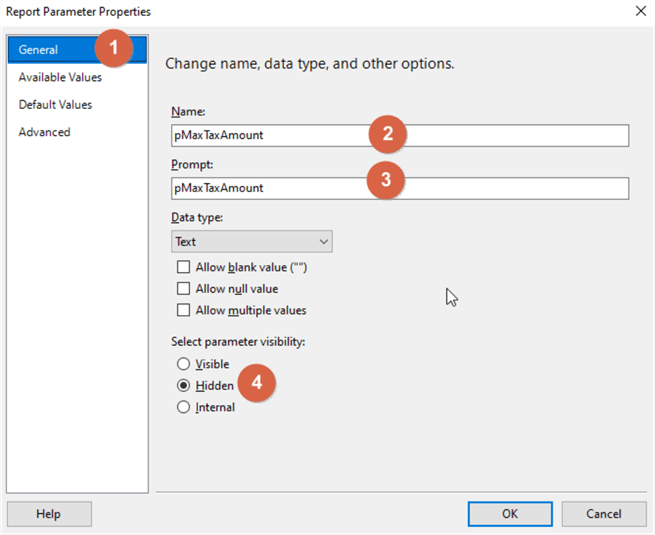
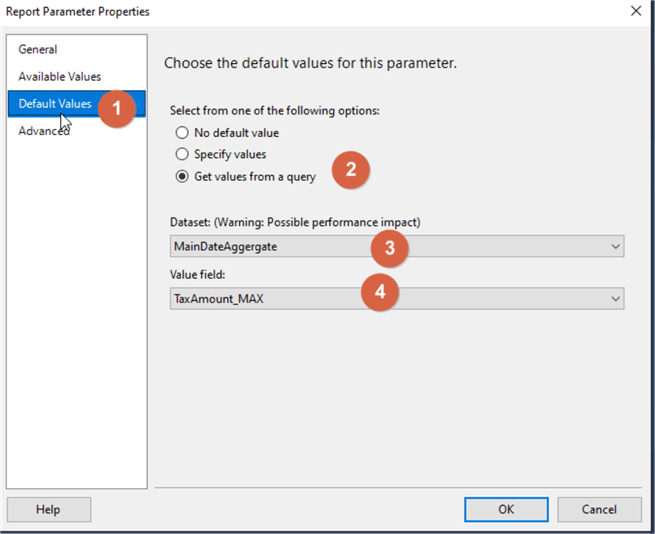
Now we can add the custom code to the report.
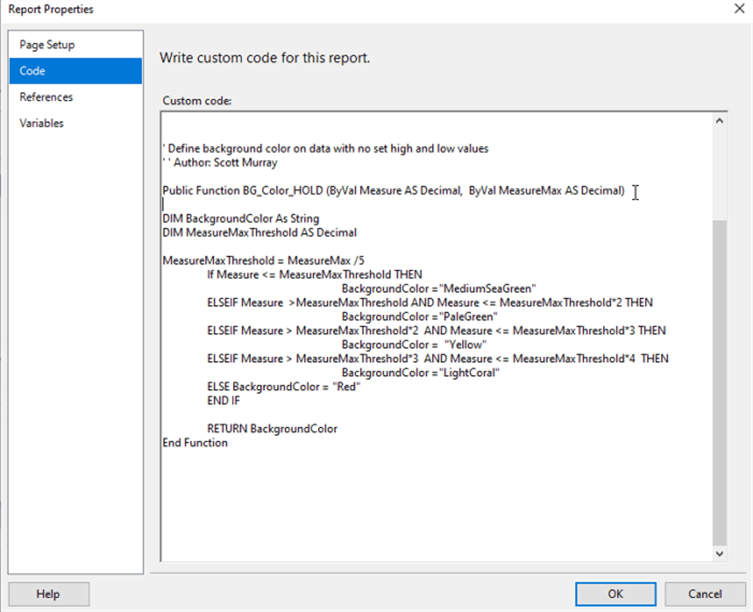
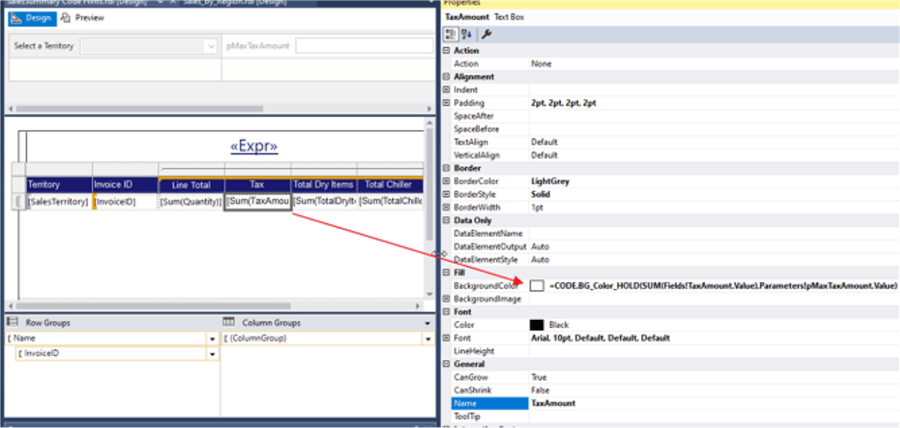
With the SQL dataset setup, the parameter created, and the code added to the report properties, we can now implement for the Tax Amount textbox. As shown below, the function uses two arguments; the first argument being passed to the function is the Tax Amount value. The second argument is the maximum Tax Amount from the aggregate query; this value is sourced through a parameter.
=CODE.BG_Color_HOLD(SUM(Fields!TaxAmount.Value),Parameters!pMaxTaxAmount.Value)
The aggregate data set cannot be called directly from a visual (the Tablix visual) which uses another dataset. One alternative that could be used is to include the maximum and minimum values in the main data set.
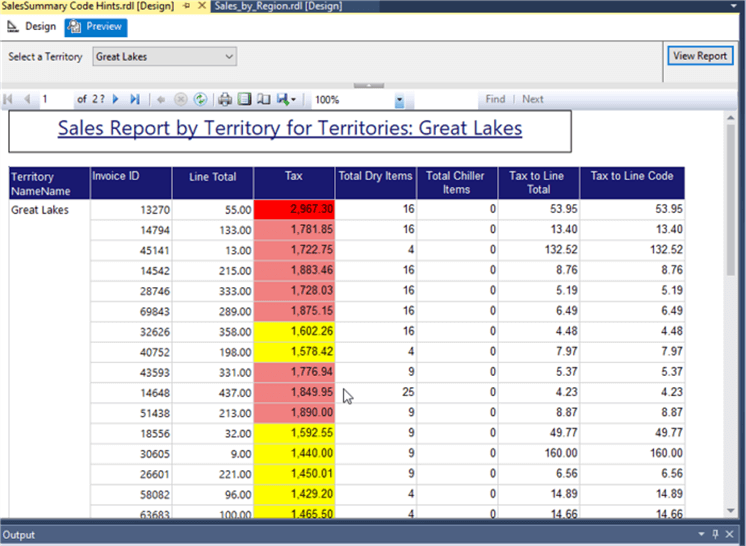
As illustrated below, we now have a flexible way to implement conditional formatting in a textbox without using fixed interval values. The color coding will adjust as the max value adjusts; note a large outlier value could impact this setup.
One potential caveat to using the report code is that it must be copied from report to report or utilized in some sort of SSRS report template. However, once perfected, the code can be easily copied from report to report and can be used to control many options and properties including items, such as, font and background colors, and custom, complex formulas.
SSRS Code for Automatic Export
This particular area of knowledge centers on being sure to know your report audience and what their desired output options will be. Using these pieces of information, you can cater the end version of your report to that particular audience. A reporting being exported to Excel has a very different look and potentially navigation path then one being exported to PDF; a PDF report is often printed, while Excel reports are often used for further processing.
For example if you have a report that will always be exported to Excel, you can format the report in such a way that it exports to Excel in an appropriate format for easier reading in Excel. You may want to export to multiple Excel worksheets as described in this tip: Export SQL Server Reporting Services Report Data into Multiple Excel Worksheets. Finally one of the newer features to exporting that I have found helpful in certain instances is exporting a report to Power Point. This tip describes that process in detail: Exporting SQL Server Reporting Services Reports to PowerPoint.
All these different methods bring us to another code set; one in which we can do these exports automatically while at the same time passing a render format (for example Excel, Word, PDF, etc.) and any parameter values. This information is passed via URL string commonly known as URL access. Using this method, we can actually automatically download the report. The commands are initiated from the report server command set, rs:. We will cover several of the report server command, but SSRS also includes the report viewer rv: commands which are beyond the scope of our tip.
In order to complete the direct export of the desired file, we need to build a URL string that tells SSRS each of the following items:
- report server name / address -- line 1
- report folder (and sub folders if needed) – line 2
- report name – line 3
- report parameters – lines 4 and 5
- render format using the rs:Format Command – line 6
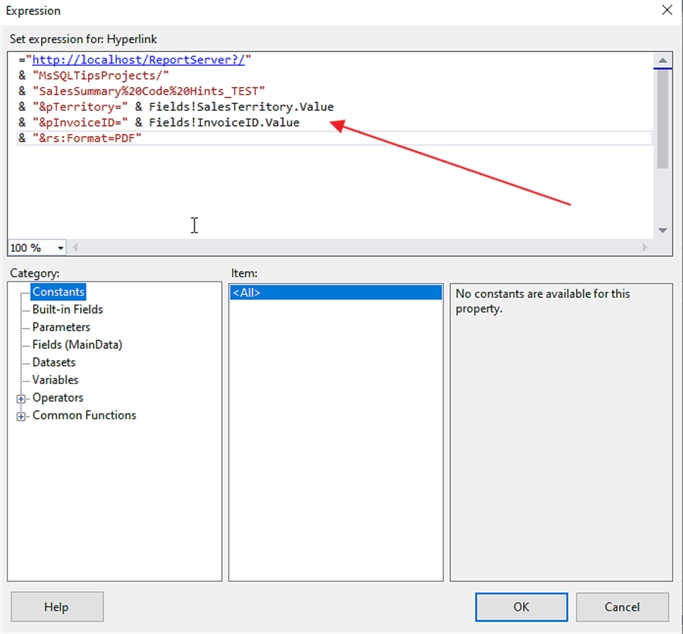
="http://localhost/ReportServer?/"
& "MsSQLTipsProjects/"
& "SalesSummary%20Code%20Hints_TEST"
& "&pTerritory=" & Fields!SalesTerritory.Value
& "&pInvoiceID=" & Fields!InvoiceID.Value
& "&rs:Format=PDF"
In In order to completely automate the export of the file, all required parameters must either have a default value or a parameter value must be included in the URL string being created; as shown above, multiple parameters can be sent in the URL string. Additionally, we could just as easily change the rs:Format to Excel or Word, or even give the report consumers a choice via a parameter or clicking on a particular text box. We have 2 more steps to complete our process. First, we will create an action in the Invoice ID textbox as shown below.
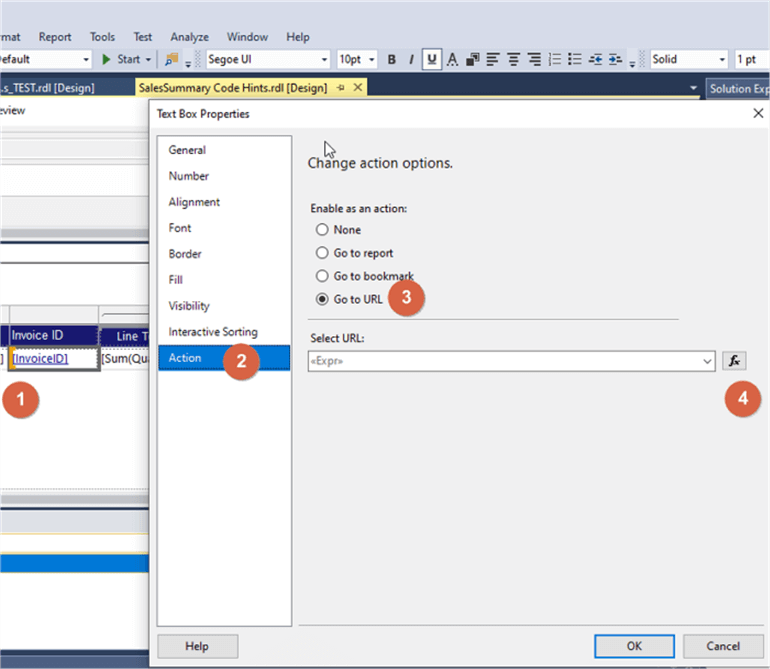
Next, we add the code to our expression builder.
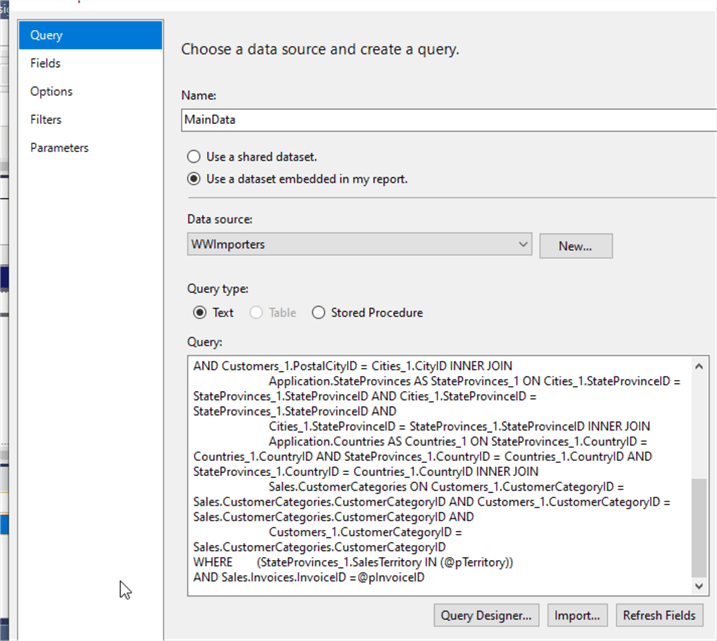
We then need to create a report which accepts the parameters that we are passing; to keep our example simple, I copied the main report and added the Invoice ID parameter to the report and also to the where clause in the data set’s query.
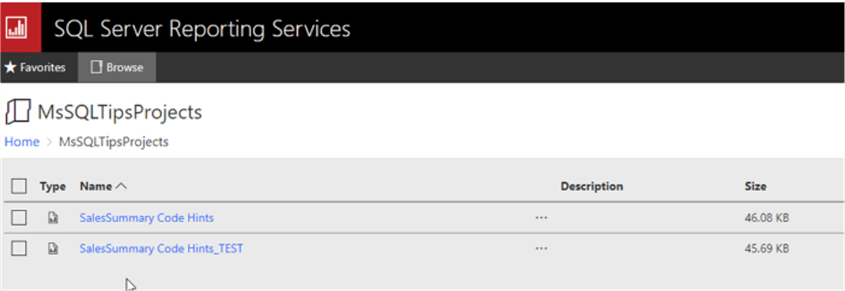
Finally, we need to publish both reports (and any related data sets as needed) to the report server.
With all that work complete, we are now ready to test out our new link. Notice how in the below illustration, hovering over the InvoiceID shows the link for the "GOTO" report with the appropriate URL, Parameters, and Render format.
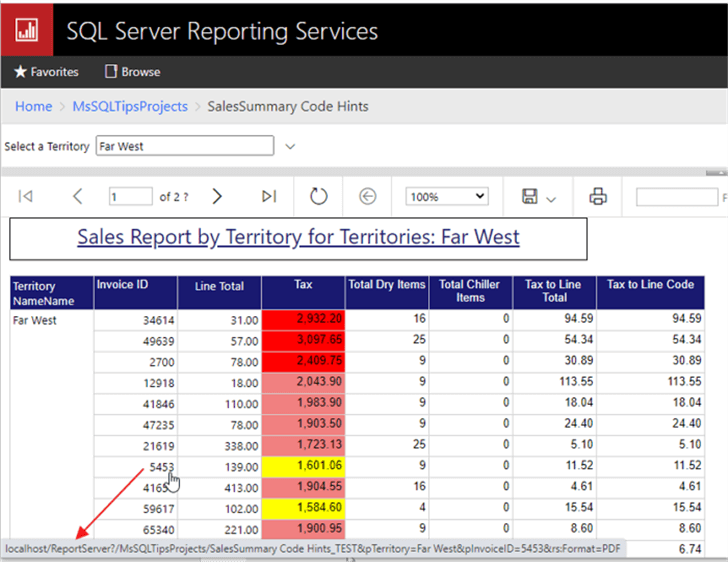
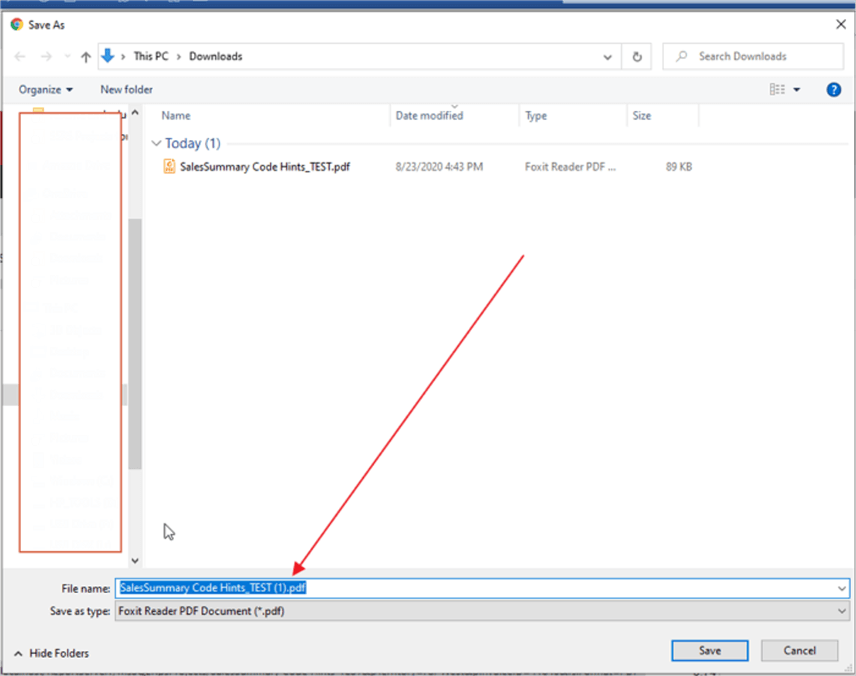
Clicking on the link automatically runs the report and saves the file to your local download folder.
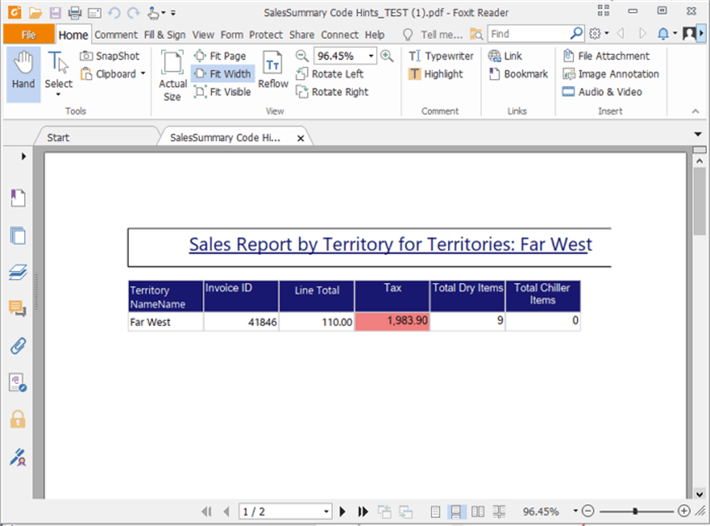
We now have a quick and easy method to export our report automatically. The PDF version of the report is shown below. With a simple click we generated a report that was automatically exported to our local directory.
SSRS Code for Multi-line Report Titles
Another common issue is folks requesting text be displayed on multiple lines within a text box or tooltip.
For instance, in the below example, how do you display the report title on multiple lines?
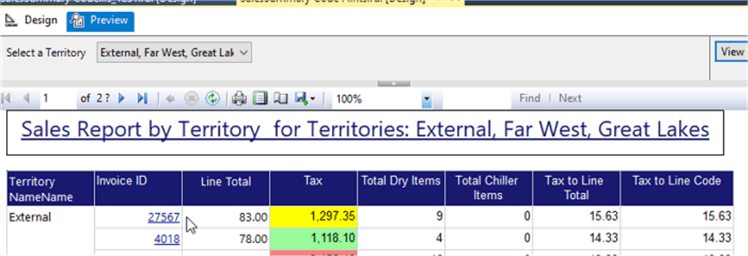
To accomplish this request, you would think that you could just move items to new lines within the textbox’s expression, as illustrated below. However, that does not work!
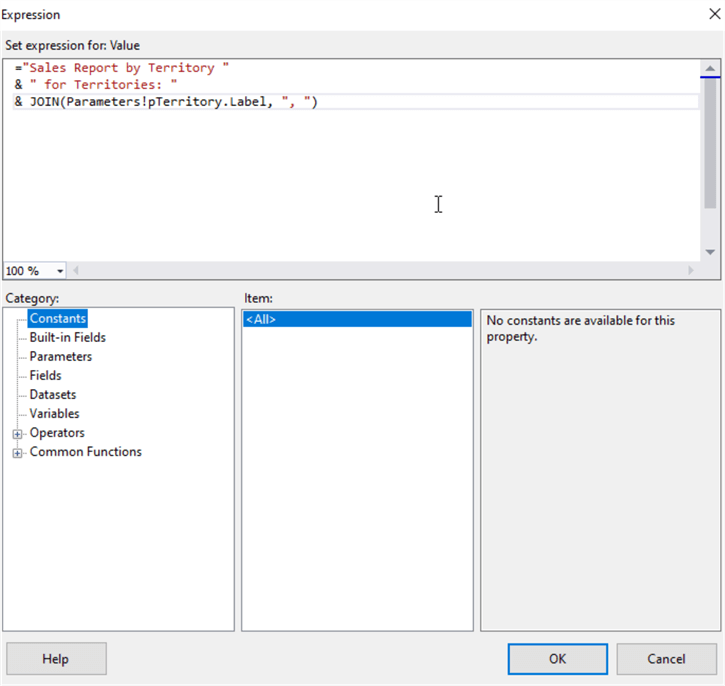
Nevertheless, we can easily add the vb constants which signify a line feed / carriage return. As shown below, two options are available. The first and somewhat clearer is to use "vbcrlf" or you can use the codes with a translation to the line feed / carriage return of chr(10) & chr(13).
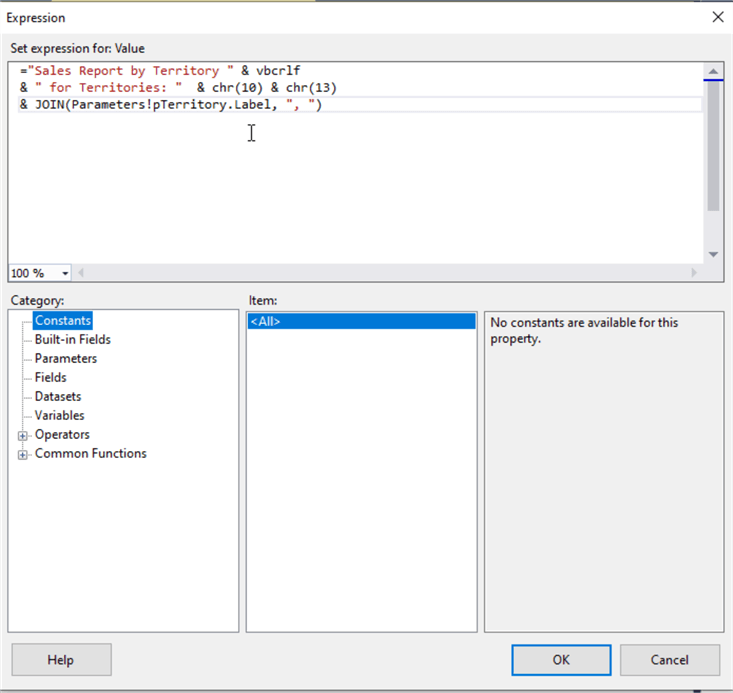
Adding these code strings, as shown above, now produces a multiline report title which is illustrated below.
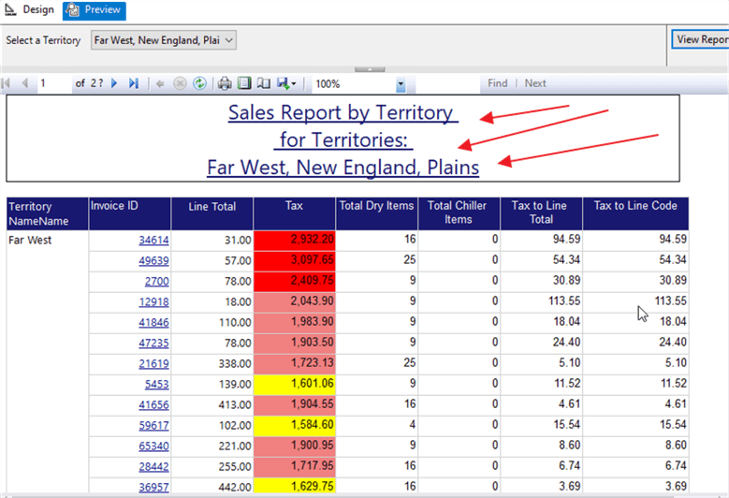
The above code is what I would consider an "oldie but goodie" set of code to use throughout not just SSRS, but other code applications.
SSRS Code for Adding Special Characters to a Report
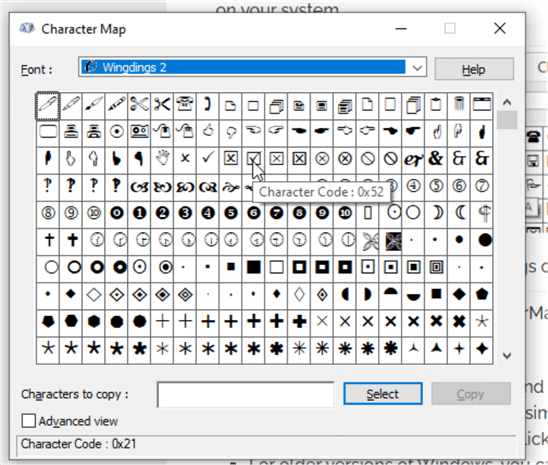
Alternately, report requesters could also request special characters be displayed on a report. The next code item is one that I find less common but is useful to match a process or form used by report consumers. For this example, say a report request requires the use of check box on the report. The box is checked if a threshold is met or unchecked if a threshold is not met. One alternative is to use built in SSRS indicators, but you are limited in actual indicator images contained in SSRS. A more expansive option with a wide variety of different visuals is to actually use the Wingdings fonts, specifically Wingdings 2 which contains a check mark in a box and just a box.
To find the available images, on Windows 10 you can run the Character Map application that is built in to Windows 10. As you can see below, the checkbox is in hex code 0x52. There are several online tools to convert the hex number to the character number such as: https://coding.tools/hex-to-binary or https://www.barcodefaq.com/ascii-chart-char-set/. For our example, we used 0x52 for the check box and 0xA3 for the unchecked box.
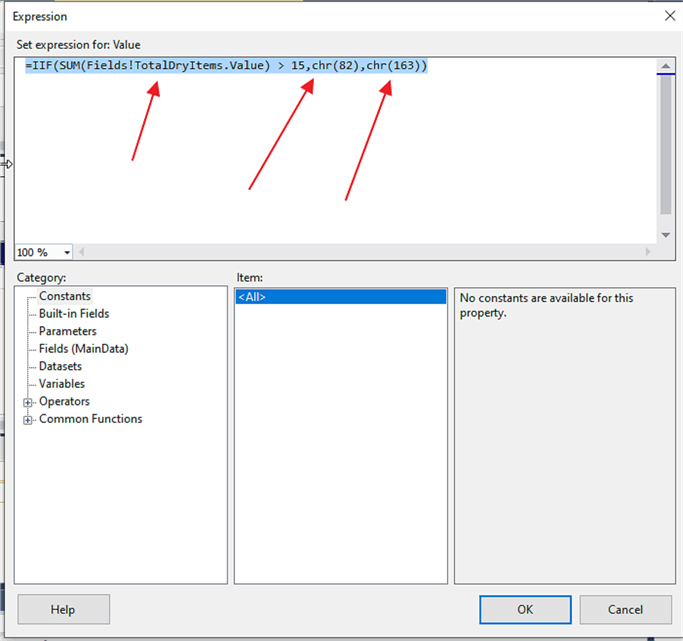
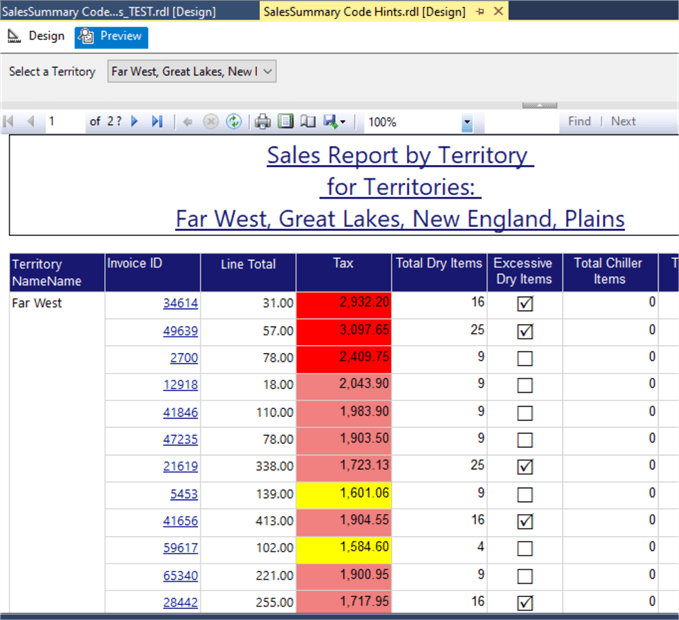
With characters values determined, we can now create the expression for our text box. For the below code we compare the TotalDryItem measure to 15; if it is greater than 15, then the box will be checked, otherwise an unchecked box will be displayed.
=IIF(SUM(Fields!TotalDryItems.Value) > 15,chr(82),chr(163))
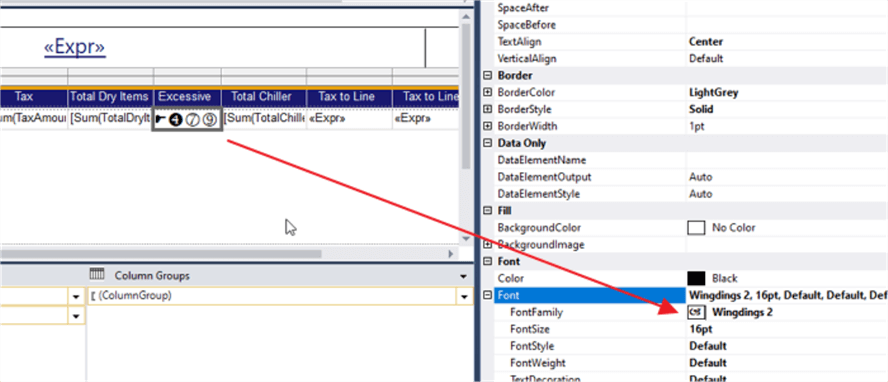
Finally, we need to set the Font to Wingdings 2 for the textbox.
Now running the report shows our column with our checked and unchecked boxes! You could easily port this code to use several other icons.
Conclusion
In In this tip we covered some various SSRS common code that can be used to make your SSRS development easier and more efficient while at the same time solving some common issues with SSRS development.
Next Steps
About the author
 Scott Murray has a passion for crafting BI Solutions with SharePoint, SSAS, OLAP and SSRS.
This author pledges the content of this article is based on professional experience and not AI generated.
View all my tips


